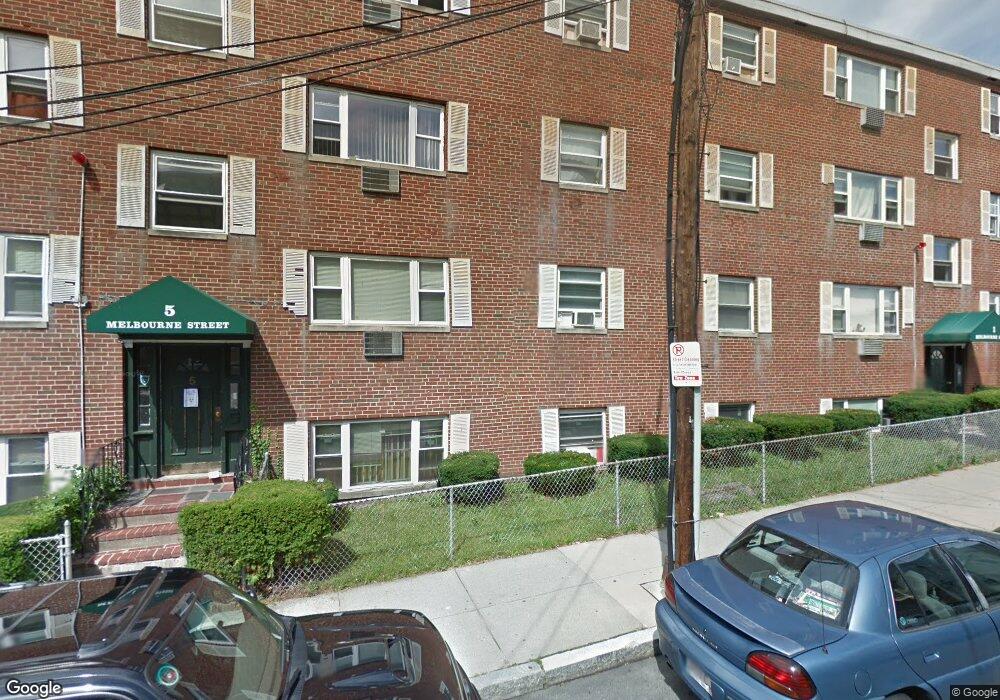
5 Melbourne St Unit 7 Dorchester Center, MA 02124
Saint Marks NeighborhoodEstimated Value: $273,000 - $418,000
2
Beds
1
Bath
600
Sq Ft
$590/Sq Ft
Est. Value
About This Home
This home is located at 5 Melbourne St Unit 7, Dorchester Center, MA 02124 and is currently estimated at $354,259, approximately $590 per square foot. 5 Melbourne St Unit 7 is a home located in Suffolk County with nearby schools including Codman Academy Charter Public School and Epiphany School.
Ownership History
Date
Name
Owned For
Owner Type
Purchase Details
Closed on
Jan 31, 2011
Sold by
Stella Michael
Bought by
Boston City Of
Current Estimated Value
Purchase Details
Closed on
Sep 19, 2008
Sold by
Hsbc Bank Usa
Bought by
Stella Michael A
Purchase Details
Closed on
Sep 18, 2008
Sold by
Rivera Sonia and Countrywide Home Loans
Bought by
Hsbc Bank Usa
Purchase Details
Closed on
Jun 27, 2007
Sold by
Valdes Jose R and Rivera Sonia
Bought by
Rivera Sonia
Purchase Details
Closed on
May 30, 2006
Sold by
Rivera Carlos and Rivera Sonia
Bought by
Valdes Jose R and Rivera Sonia
Purchase Details
Closed on
Dec 4, 2003
Sold by
Chowdhury Taslim
Bought by
Rivera Carlos and Rivera Sonia
Home Financials for this Owner
Home Financials are based on the most recent Mortgage that was taken out on this home.
Original Mortgage
$121,500
Interest Rate
6.03%
Mortgage Type
Purchase Money Mortgage
Create a Home Valuation Report for This Property
The Home Valuation Report is an in-depth analysis detailing your home's value as well as a comparison with similar homes in the area
Home Values in the Area
Average Home Value in this Area
Purchase History
| Date | Buyer | Sale Price | Title Company |
|---|---|---|---|
| Boston City Of | $326 | -- | |
| Stella Michael A | $67,000 | -- | |
| Hsbc Bank Usa | $164,815 | -- | |
| Rivera Sonia | -- | -- | |
| Rivera Sonia | -- | -- | |
| Valdes Jose R | -- | -- | |
| Rivera Carlos | $136,000 | -- |
Source: Public Records
Mortgage History
| Date | Status | Borrower | Loan Amount |
|---|---|---|---|
| Previous Owner | Rivera Carlos | $121,500 |
Source: Public Records
Tax History Compared to Growth
Tax History
| Year | Tax Paid | Tax Assessment Tax Assessment Total Assessment is a certain percentage of the fair market value that is determined by local assessors to be the total taxable value of land and additions on the property. | Land | Improvement |
|---|---|---|---|---|
| 2025 | $3,399 | $293,500 | $0 | $293,500 |
| 2024 | $3,238 | $297,100 | $0 | $297,100 |
| 2023 | $3,096 | $288,300 | $0 | $288,300 |
| 2022 | $2,959 | $272,000 | $0 | $272,000 |
| 2021 | $2,785 | $261,000 | $0 | $261,000 |
| 2020 | $1,719 | $162,800 | $0 | $162,800 |
| 2019 | $1,618 | $153,500 | $0 | $153,500 |
| 2018 | $1,490 | $142,200 | $0 | $142,200 |
| 2017 | $1,552 | $146,600 | $0 | $146,600 |
| 2016 | $1,507 | $137,000 | $0 | $137,000 |
| 2015 | $1,563 | $129,100 | $0 | $129,100 |
| 2014 | $1,489 | $118,400 | $0 | $118,400 |
Source: Public Records
Map
Nearby Homes
- 131 Centre St
- 123-125 Centre St Unit TH 6
- 123-125 Centre St Unit TH4
- 19 Nixon St
- 57 Mather St
- 61 Lyndhurst St Unit A
- 23 Roseland St
- 18 Santuit St
- 438 Talbot Ave
- 28 Melville Ave
- 31 Tremlett St
- 15 Mather St
- 24 Alpha Rd Unit 1
- 49 Alpha Rd
- 61 Shepton St
- 1613 Dorchester Ave Unit 1
- 37 Msgr Patrick j Lydon Way
- 80-84 Shepton St Unit 80-3
- 54 Msgr Patrick j Lydon Way
- 26 Harley St Unit 1
- 5 Melbourne St Unit 8
- 5 Melbourne St Unit 6
- 5 Melbourne St
- 5 Melbourne St Unit 4
- 5 Melbourne St Unit 3
- 5 Melbourne St Unit 2
- 5 Melbourne St Unit 1
- 5 Melbourne St Unit 8L,5
- 1 Melbourne St Unit 2R
- 1 Melbourne St Unit 6R
- 1 Melbourne St Unit 7
- 1 Melbourne St Unit 6
- 1 Melbourne St Unit 5
- 1 Melbourne St Unit 4
- 1 Melbourne St Unit 3
- 1 Melbourne St Unit 2
- 1 Melbourne St
- 1 Melbourne St Unit 1
- 1 Melbourne St Unit 8,1
- 1 Melbourne St Unit 1R