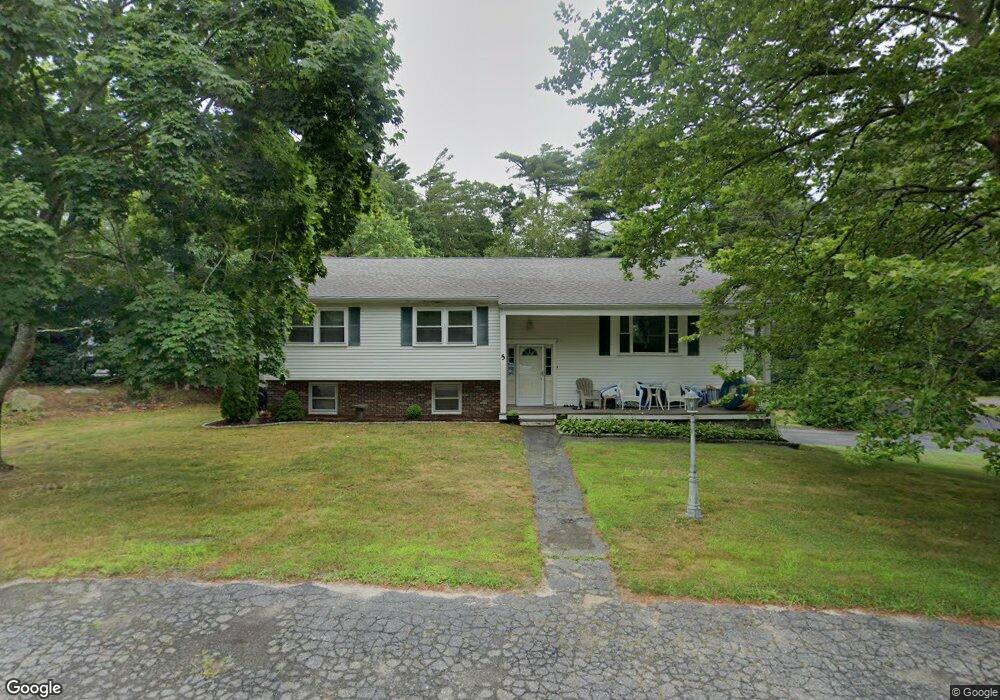
5 Midway Rd Pocasset, MA 02559
Monument Beach NeighborhoodEstimated Value: $614,000 - $771,000
3
Beds
3
Baths
1,984
Sq Ft
$344/Sq Ft
Est. Value
About This Home
This home is located at 5 Midway Rd, Pocasset, MA 02559 and is currently estimated at $682,764, approximately $344 per square foot. 5 Midway Rd is a home located in Barnstable County with nearby schools including Bourne High School, Cadence Academy Preschool - Bourne, and St Margaret Regional School.
Ownership History
Date
Name
Owned For
Owner Type
Purchase Details
Closed on
Mar 30, 2018
Sold by
Dayton Mark D
Bought by
Tessier Melissa and Budrewicz Pete
Current Estimated Value
Home Financials for this Owner
Home Financials are based on the most recent Mortgage that was taken out on this home.
Original Mortgage
$333,841
Outstanding Balance
$285,451
Interest Rate
4.38%
Mortgage Type
FHA
Estimated Equity
$397,313
Purchase Details
Closed on
Dec 19, 2007
Sold by
Muise Cheryl A
Bought by
Dayton Mark D
Home Financials for this Owner
Home Financials are based on the most recent Mortgage that was taken out on this home.
Original Mortgage
$170,000
Interest Rate
6.3%
Mortgage Type
Purchase Money Mortgage
Create a Home Valuation Report for This Property
The Home Valuation Report is an in-depth analysis detailing your home's value as well as a comparison with similar homes in the area
Home Values in the Area
Average Home Value in this Area
Purchase History
| Date | Buyer | Sale Price | Title Company |
|---|---|---|---|
| Tessier Melissa | $340,000 | -- | |
| Tessier Melissa | $340,000 | -- | |
| Dayton Mark D | $300,000 | -- | |
| Dayton Mark D | $300,000 | -- |
Source: Public Records
Mortgage History
| Date | Status | Borrower | Loan Amount |
|---|---|---|---|
| Open | Tessier Melissa | $333,841 | |
| Closed | Tessier Melissa | $333,841 | |
| Previous Owner | Dayton Mark D | $170,000 | |
| Previous Owner | Dayton Mark D | $170,000 |
Source: Public Records
Tax History Compared to Growth
Tax History
| Year | Tax Paid | Tax Assessment Tax Assessment Total Assessment is a certain percentage of the fair market value that is determined by local assessors to be the total taxable value of land and additions on the property. | Land | Improvement |
|---|---|---|---|---|
| 2025 | $4,439 | $568,400 | $199,400 | $369,000 |
| 2024 | $4,340 | $541,200 | $189,900 | $351,300 |
| 2023 | $4,255 | $483,000 | $168,000 | $315,000 |
| 2022 | $4,023 | $398,700 | $148,700 | $250,000 |
| 2021 | $3,000 | $362,800 | $135,300 | $227,500 |
| 2020 | $3,789 | $352,800 | $134,100 | $218,700 |
| 2019 | $3,579 | $340,500 | $134,100 | $206,400 |
| 2018 | $3,518 | $333,800 | $127,700 | $206,100 |
| 2017 | $3,266 | $317,100 | $120,200 | $196,900 |
| 2016 | $2,755 | $271,200 | $120,200 | $151,000 |
| 2015 | $2,603 | $258,500 | $107,500 | $151,000 |
Source: Public Records
Map
Nearby Homes
- 566 Shore Rd
- 501 County Rd
- 515 County Rd
- 18 Douglas Ave
- 30 Howard Ave
- 39 Bennets Neck Dr
- 14 Navajo Rd
- 18 Carlton Rd
- 105 Clay Pond Rd
- 93 Valley Bars Rd
- 709 County Rd
- 254 Barlows Landing Rd
- 174 Barlows Landing Rd
- 940 County Rd
- 12 Beachwood Rd
- 70 Wings Neck Rd
- 15 1st St
- 2 Westerly Dr
- 24 Richmond Rd
- 203 County Rd