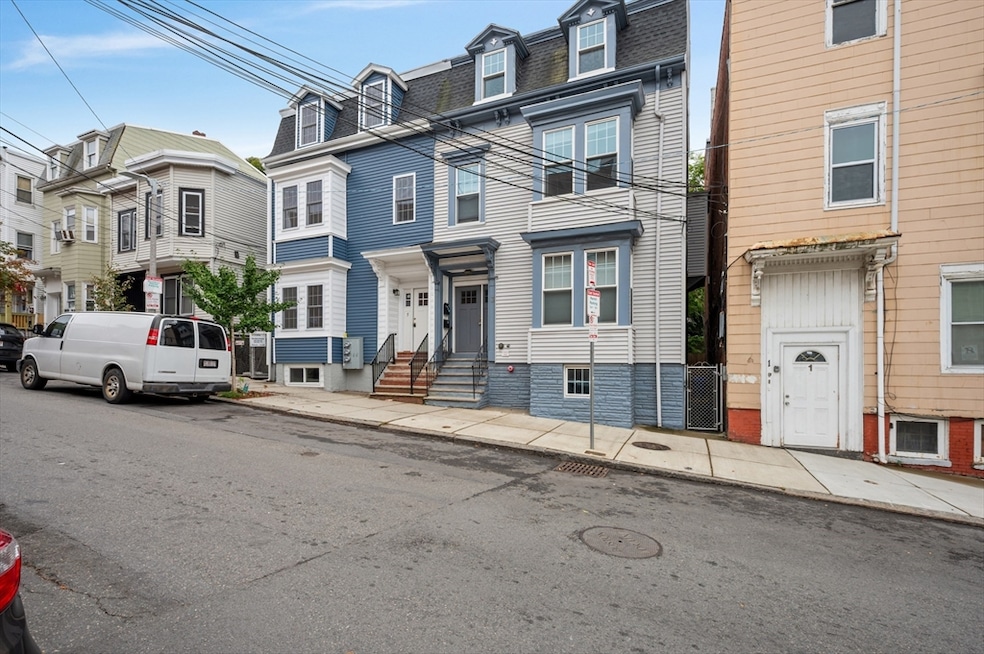
5 Monmouth St Unit 2 Boston, MA 02128
Eagle Hill NeighborhoodEstimated payment $3,161/month
Highlights
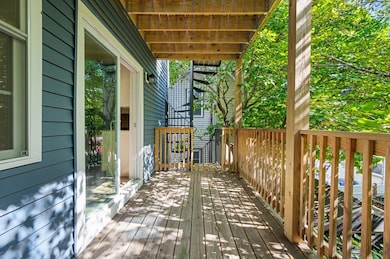
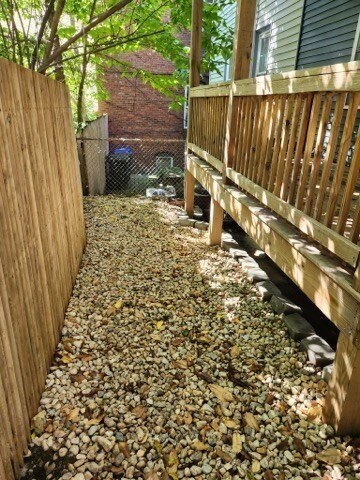
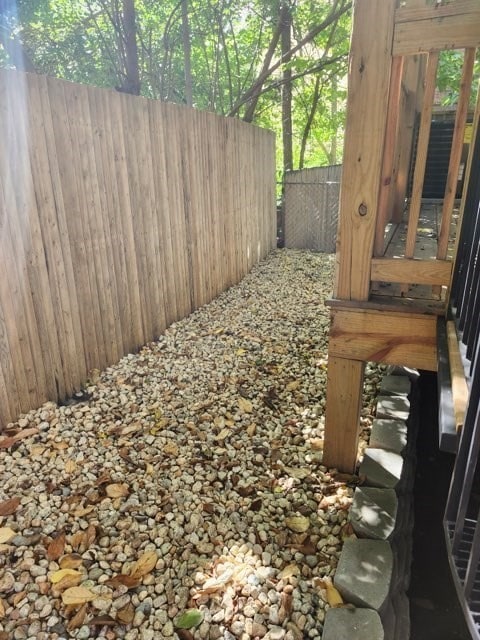
- Deck
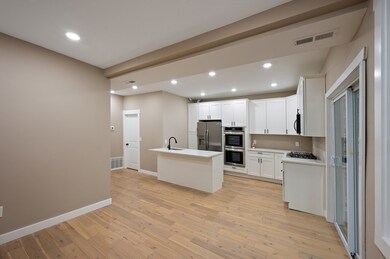
- Wood Flooring
- Central Heating and Cooling System
- Property is near public transit
- Shops
- 4-minute walk to South Shore Plaza Park
About This Home
Remodeled East Boston Condo featuring4 Rooms | 2 Bedrooms | 1 Bathroom698 sq ft of bright, open living space. Spacious open-concept kitchen with white shaker cabinets, stainless steel appliances, and gleaming hardwood floors. Kitchen flows seamlessly into a generous living room – perfect for entertaining with Large sliding glass doors lead to your private oversized deck – ideal for morning coffee or summer BBQs. Freshly updated, well-maintained, and priced to sell quickly! All 3 units in the building are currently available for sale. Buy this condo individually or purchase the entire 3-unit building and create instant equity – live in one and rent the others, rent all three, or sell them separately. Priced aggressively in today’s hot East Boston market – this one won’t last! Schedule your private showing today.
Property Details
Home Type
- Condominium
Est. Annual Taxes
- $2,093
Year Built
- Built in 1900
HOA Fees
- $260 Monthly HOA Fees
Home Design
- Entry on the 2nd floor
Interior Spaces
- 698 Sq Ft Home
- 1-Story Property
- Wood Flooring
- Laundry on upper level
Kitchen
- Range
- Microwave
- Dishwasher
- Disposal
Bedrooms and Bathrooms
- 2 Bedrooms
- Primary bedroom located on second floor
- 1 Full Bathroom
Location
- Property is near public transit
- Property is near schools
Utilities
- Central Heating and Cooling System
- 1 Cooling Zone
- 1 Heating Zone
Additional Features
- Deck
- Two or More Common Walls
Listing and Financial Details
- Assessor Parcel Number 1333824
Community Details
Overview
- Association fees include water, sewer, insurance, maintenance structure, ground maintenance
- 3 Units
Amenities
- Shops
Pet Policy
- Pets Allowed
Map
Home Values in the Area
Average Home Value in this Area
Tax History
| Year | Tax Paid | Tax Assessment Tax Assessment Total Assessment is a certain percentage of the fair market value that is determined by local assessors to be the total taxable value of land and additions on the property. | Land | Improvement |
|---|---|---|---|---|
| 2025 | $6,487 | $560,200 | $107,200 | $453,000 |
| 2024 | $4,589 | $421,000 | $93,400 | $327,600 |
| 2023 | $4,475 | $416,700 | $92,400 | $324,300 |
| 2022 | $6,768 | $622,100 | $169,600 | $452,500 |
| 2021 | $6,638 | $622,100 | $169,600 | $452,500 |
| 2020 | $5,583 | $528,700 | $186,100 | $342,600 |
| 2019 | $4,975 | $472,000 | $115,200 | $356,800 |
| 2018 | $4,415 | $421,300 | $115,200 | $306,100 |
| 2017 | $3,878 | $366,200 | $115,200 | $251,000 |
| 2016 | $3,504 | $318,500 | $115,200 | $203,300 |
| 2015 | $3,278 | $270,700 | $89,900 | $180,800 |
| 2014 | $2,961 | $235,400 | $89,900 | $145,500 |
Property History
| Date | Event | Price | List to Sale | Price per Sq Ft |
|---|---|---|---|---|
| 11/11/2025 11/11/25 | Price Changed | $520,000 | -1.0% | $745 / Sq Ft |
| 11/06/2025 11/06/25 | For Sale | $525,000 | 0.0% | $752 / Sq Ft |
| 10/31/2025 10/31/25 | Off Market | $525,000 | -- | -- |
| 09/26/2025 09/26/25 | For Sale | $525,000 | -- | $752 / Sq Ft |
Purchase History
| Date | Type | Sale Price | Title Company |
|---|---|---|---|
| Foreclosure Deed | $800,000 | None Available |
Source: MLS Property Information Network (MLS PIN)
MLS Number: 73436254
APN: EBOS-000000-000001-002677
Disclaimer: Certain information contained herein is derived from information provided by parties other than Homes.com. All information provided is deemed reliable, but is not guaranteed to be accurate and should be independently verified.
![]() The property listing data and information, or the Images, set forth herein were provided to MLS Property Information Network, Inc. from third party sources, including sellers, lessors and public records, and were compiled by MLS Property Information Network, Inc. The property listing data and information, and the Images, are for the personal, non-commercial use of consumers having a good faith interest in purchasing or leasing listed properties of the type displayed to them and may not be used for any purpose other than to identify prospective properties which such consumers may have a good faith interest in purchasing or leasing. MLS Property Information Network, Inc. and its subscribers disclaim any and all representations and warranties as to the accuracy of the property listing data and information, or as to the accuracy of any of the Images, set forth herein.
The property listing data and information, or the Images, set forth herein were provided to MLS Property Information Network, Inc. from third party sources, including sellers, lessors and public records, and were compiled by MLS Property Information Network, Inc. The property listing data and information, and the Images, are for the personal, non-commercial use of consumers having a good faith interest in purchasing or leasing listed properties of the type displayed to them and may not be used for any purpose other than to identify prospective properties which such consumers may have a good faith interest in purchasing or leasing. MLS Property Information Network, Inc. and its subscribers disclaim any and all representations and warranties as to the accuracy of the property listing data and information, or as to the accuracy of any of the Images, set forth herein.
- 5 Monmouth St Unit 1
- 5 Monmouth St
- 5 Monmouth St Unit 3
- 6 Monmouth St Unit 202
- 379 Meridian St Unit 101
- 385 Meridian St Unit 1
- 36 Monmouth St
- 80 Marion St Unit 1
- 80 Marion St Unit 2
- 80 Marion St
- 605 Plan at Mira
- 301 Border St Unit 511
- 301 Border St Unit 4 - 9
- 601 Plan at Mira
- 513 Plan at Mira
- 409 Plan at Mira
- 301 Border St Unit 606
- 211 Plan at Mira
- 511 Plan at Mira
- 301 Border St Unit PH3
- 6 Monmouth St Unit 202
- 383 Meridian St
- 385 Meridian St Unit 1
- 48 Marion St Unit 512
- 345 Border St
- 28 Monmouth St Unit 1
- 14 Marion St Unit 4
- 14 Marion St Unit 1
- 345 Meridian St Unit 2
- 36 Monmouth St Unit 3
- 67 Marion St Unit 2
- 67 Marion St Unit 3
- 39 Monmouth St Unit 3
- 305 Border St Unit 508
- 50 Monmouth St Unit 1
- 301 Border St Unit 406
- 53 W Eagle St Unit 2
- 275 Border St Unit 202
- 27 Lexington St Unit 3
- 71 W Eagle St Unit 2
