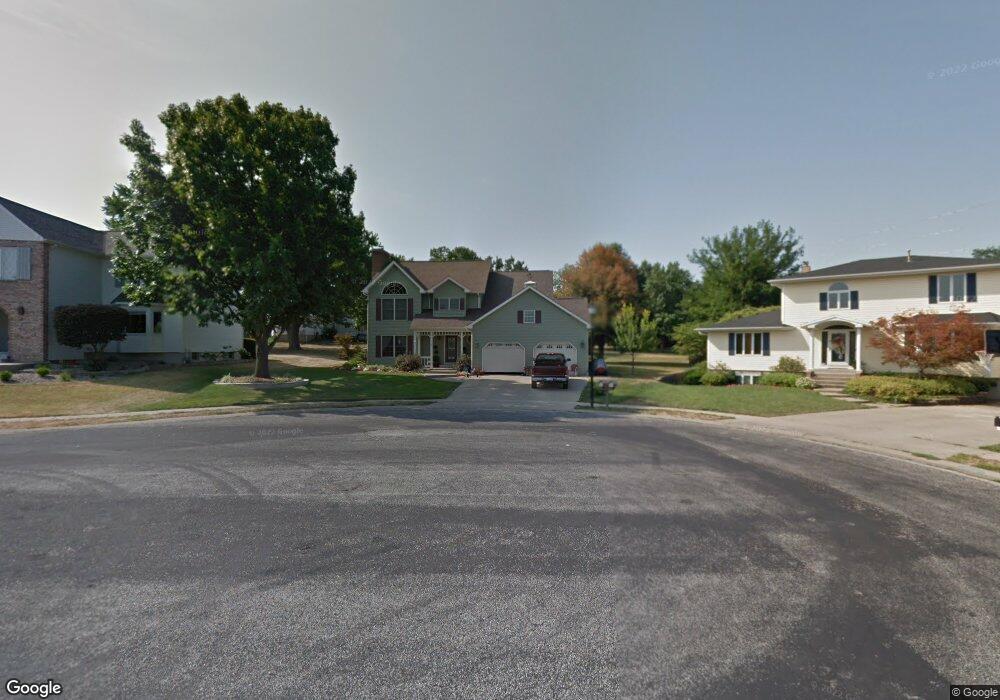
5 Monterey Ct Jacksonville, IL 62650
Estimated Value: $226,000 - $253,412
Studio
--
Bath
992
Sq Ft
$243/Sq Ft
Est. Value
About This Home
This home is located at 5 Monterey Ct, Jacksonville, IL 62650 and is currently estimated at $240,603, approximately $242 per square foot. 5 Monterey Ct is a home located in Morgan County with nearby schools including Jacksonville High School and Westfair Christian Academy.
Ownership History
Date
Name
Owned For
Owner Type
Purchase Details
Closed on
Sep 30, 2010
Sold by
Bruner David R and Bruner Angela C
Bought by
Smith Andrew L and Smith Lori A
Current Estimated Value
Home Financials for this Owner
Home Financials are based on the most recent Mortgage that was taken out on this home.
Original Mortgage
$156,000
Outstanding Balance
$102,471
Interest Rate
4.26%
Mortgage Type
New Conventional
Estimated Equity
$138,132
Create a Home Valuation Report for This Property
The Home Valuation Report is an in-depth analysis detailing your home's value as well as a comparison with similar homes in the area
Home Values in the Area
Average Home Value in this Area
Purchase History
| Date | Buyer | Sale Price | Title Company |
|---|---|---|---|
| Smith Andrew L | $195,000 | None Available |
Source: Public Records
Mortgage History
| Date | Status | Borrower | Loan Amount |
|---|---|---|---|
| Open | Smith Andrew L | $156,000 |
Source: Public Records
Tax History
| Year | Tax Paid | Tax Assessment Tax Assessment Total Assessment is a certain percentage of the fair market value that is determined by local assessors to be the total taxable value of land and additions on the property. | Land | Improvement |
|---|---|---|---|---|
| 2024 | $6,845 | $84,760 | $8,500 | $76,260 |
| 2023 | $6,328 | $76,320 | $8,500 | $67,820 |
| 2022 | $5,630 | $65,090 | $8,500 | $56,590 |
| 2021 | $5,229 | $62,060 | $8,500 | $53,560 |
| 2020 | $5,049 | $58,910 | $8,500 | $50,410 |
| 2019 | $4,974 | $58,510 | $8,500 | $50,010 |
| 2018 | $5,203 | $63,100 | $10,760 | $52,340 |
| 2017 | $5,089 | $63,100 | $10,760 | $52,340 |
| 2016 | $4,871 | $60,100 | $10,250 | $49,850 |
| 2015 | $4,754 | $57,790 | $9,860 | $47,930 |
| 2014 | $4,754 | $57,220 | $9,760 | $47,460 |
| 2013 | $4,427 | $57,220 | $9,760 | $47,460 |
Source: Public Records
Map
Nearby Homes
- 4 Ventura Ct
- 2006 Cedar St
- 000 Stevenson Dr
- 1903 Mound Rd
- 2355 Mound Rd
- 403 Locust St
- 3 Newland Ln
- 5a Eisenhower Cir
- 6 Ivywood Dr
- 510 S Westgate Ave
- 1 Sunset Dr
- 3A Justin Dr
- 11 Sommerset Dr
- 6 N Fairview Terrace
- 1401 Hoagland Blvd
- 231 N Webster Ave
- 309 Brookside Dr
- 7 Passavant Ct
- 1481 W Walnut St
- 711 Daly Dr
Your Personal Tour Guide
Ask me questions while you tour the home.