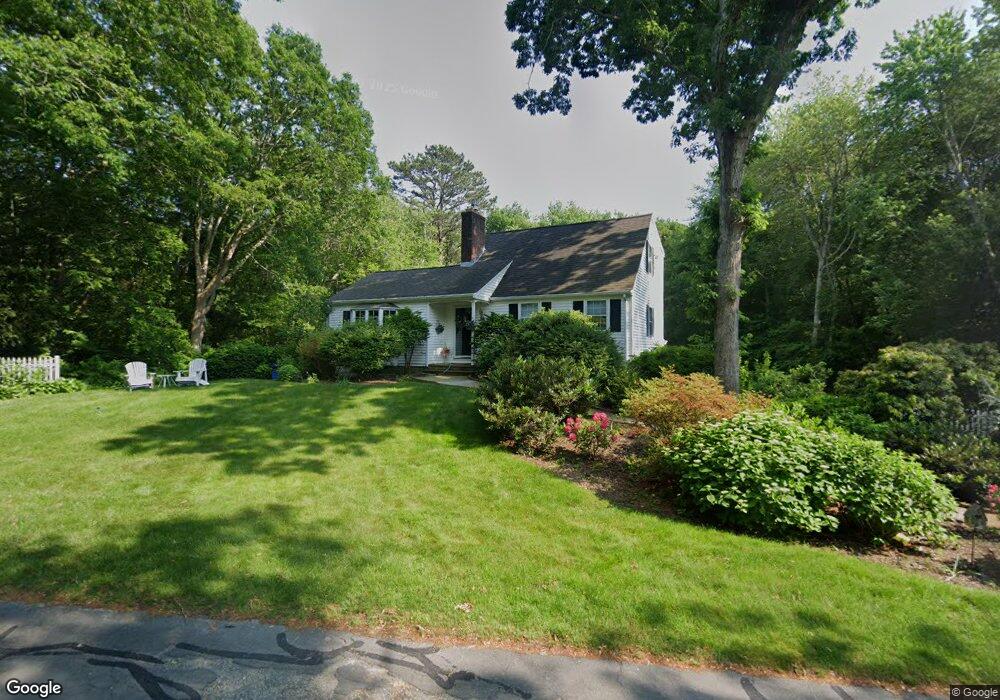
5 Moody Cir Sandwich, MA 02563
Estimated Value: $660,000 - $754,000
3
Beds
2
Baths
1,456
Sq Ft
$477/Sq Ft
Est. Value
About This Home
This home is located at 5 Moody Cir, Sandwich, MA 02563 and is currently estimated at $694,844, approximately $477 per square foot. 5 Moody Cir is a home located in Barnstable County with nearby schools including Sandwich Middle High School, Waldorf School of Cape Cod, and Bridgeview Montessori School.
Ownership History
Date
Name
Owned For
Owner Type
Purchase Details
Closed on
Mar 8, 2017
Sold by
Anderson Maryellen and Anderson Steve C
Bought by
Anderson Jennifer L and Anderson John R
Current Estimated Value
Purchase Details
Closed on
Nov 30, 2001
Sold by
Joyce Susan Ann
Bought by
Anderson Steve C and Anderson Maryellen
Purchase Details
Closed on
Jul 28, 1989
Sold by
Norton Russell B
Bought by
Joyce Robert
Create a Home Valuation Report for This Property
The Home Valuation Report is an in-depth analysis detailing your home's value as well as a comparison with similar homes in the area
Home Values in the Area
Average Home Value in this Area
Purchase History
| Date | Buyer | Sale Price | Title Company |
|---|---|---|---|
| Anderson Jennifer L | -- | -- | |
| Anderson Maryellen | -- | -- | |
| Anderson Steve C | $235,000 | -- | |
| Joyce Robert | $167,000 | -- |
Source: Public Records
Mortgage History
| Date | Status | Borrower | Loan Amount |
|---|---|---|---|
| Previous Owner | Joyce Robert | $196,000 | |
| Previous Owner | Joyce Robert | $227,500 | |
| Previous Owner | Joyce Robert | $85,000 |
Source: Public Records
Tax History Compared to Growth
Tax History
| Year | Tax Paid | Tax Assessment Tax Assessment Total Assessment is a certain percentage of the fair market value that is determined by local assessors to be the total taxable value of land and additions on the property. | Land | Improvement |
|---|---|---|---|---|
| 2025 | $5,850 | $553,500 | $192,000 | $361,500 |
| 2024 | $6,292 | $582,600 | $236,800 | $345,800 |
| 2023 | $5,737 | $498,900 | $184,600 | $314,300 |
| 2022 | $5,550 | $421,700 | $164,800 | $256,900 |
| 2021 | $5,286 | $383,900 | $158,400 | $225,500 |
| 2020 | $5,409 | $378,000 | $161,200 | $216,800 |
| 2019 | $5,048 | $352,500 | $151,900 | $200,600 |
| 2018 | $2,497 | $309,200 | $146,700 | $162,500 |
| 2017 | $4,383 | $293,600 | $141,900 | $151,700 |
| 2016 | $4,172 | $288,300 | $138,200 | $150,100 |
| 2015 | $4,030 | $271,900 | $124,500 | $147,400 |
Source: Public Records
Map
Nearby Homes