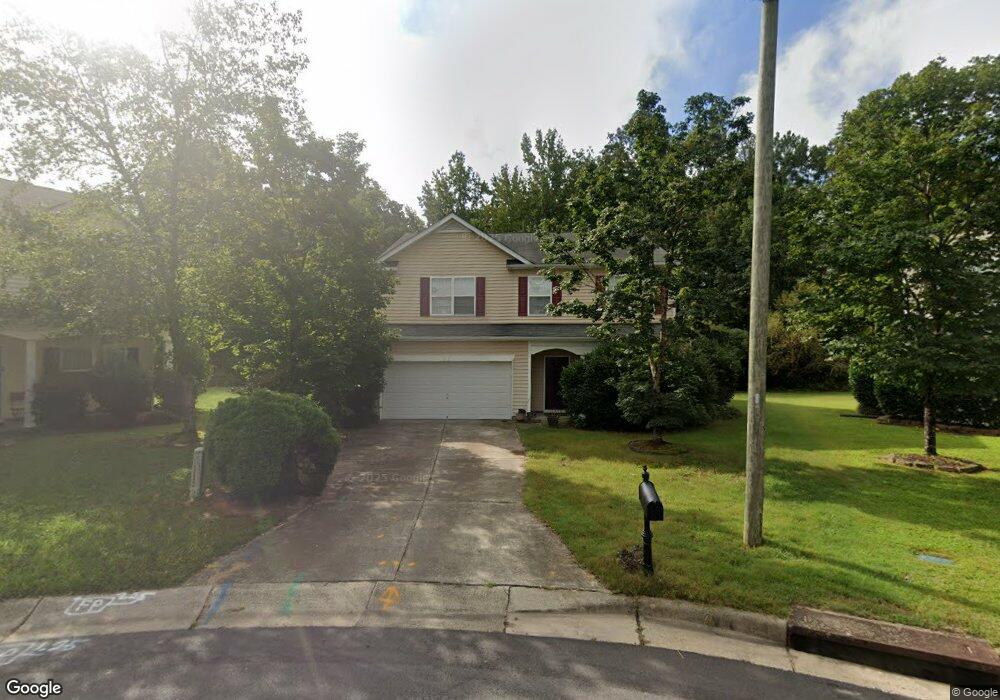
5 Mooring Ct Durham, NC 27703
Eastern Durham NeighborhoodEstimated Value: $428,000 - $478,000
4
Beds
3
Baths
2,740
Sq Ft
$166/Sq Ft
Est. Value
About This Home
This home is located at 5 Mooring Ct, Durham, NC 27703 and is currently estimated at $455,156, approximately $166 per square foot. 5 Mooring Ct is a home located in Durham County with nearby schools including Oak Grove Elementary, John W Neal Middle School, and Southern School of Energy & Sustainability.
Ownership History
Date
Name
Owned For
Owner Type
Purchase Details
Closed on
Jul 29, 2016
Sold by
D R Horton Inc Torrey
Bought by
Ford Richard A and Waters Milford H
Current Estimated Value
Purchase Details
Closed on
Jul 29, 2005
Sold by
D R Horton Inc
Bought by
Ford Richard A and Waters Milford H
Home Financials for this Owner
Home Financials are based on the most recent Mortgage that was taken out on this home.
Original Mortgage
$39,476
Interest Rate
5.59%
Mortgage Type
Purchase Money Mortgage
Create a Home Valuation Report for This Property
The Home Valuation Report is an in-depth analysis detailing your home's value as well as a comparison with similar homes in the area
Home Values in the Area
Average Home Value in this Area
Purchase History
| Date | Buyer | Sale Price | Title Company |
|---|---|---|---|
| Ford Richard A | -- | -- | |
| Ford Richard A | $197,500 | Bb&T |
Source: Public Records
Mortgage History
| Date | Status | Borrower | Loan Amount |
|---|---|---|---|
| Previous Owner | Ford Richard A | $39,476 | |
| Previous Owner | Ford Richard A | $157,904 |
Source: Public Records
Tax History Compared to Growth
Tax History
| Year | Tax Paid | Tax Assessment Tax Assessment Total Assessment is a certain percentage of the fair market value that is determined by local assessors to be the total taxable value of land and additions on the property. | Land | Improvement |
|---|---|---|---|---|
| 2025 | $4,733 | $477,413 | $64,297 | $413,116 |
| 2024 | $3,907 | $280,092 | $44,531 | $235,561 |
| 2023 | $3,669 | $280,092 | $44,531 | $235,561 |
| 2022 | $3,585 | $280,092 | $44,531 | $235,561 |
| 2021 | $3,568 | $280,092 | $44,531 | $235,561 |
| 2020 | $3,484 | $280,092 | $44,531 | $235,561 |
| 2019 | $3,484 | $280,092 | $44,531 | $235,561 |
| 2018 | $2,994 | $220,732 | $34,375 | $186,357 |
| 2017 | $2,972 | $220,732 | $34,375 | $186,357 |
| 2016 | $2,872 | $220,732 | $34,375 | $186,357 |
| 2015 | $2,837 | $204,950 | $41,632 | $163,318 |
| 2014 | $2,837 | $204,950 | $41,632 | $163,318 |
Source: Public Records
Map
Nearby Homes
- 1 Kings Grant Ct
- 208 Lick Creek Ln
- 301 Sylvias Ct
- 110 Kindlewood Dr
- 106 Newberry Ln
- 406 Robbins Rd
- 402 Robbins Rd
- 10 Autrey Mill Cir
- 503 Bellmeade Bay Dr
- 615 Southshore Pkwy
- 103 Bermuda Green Dr
- 1 Thorn Brook Ct
- 715 Southshore Pkwy
- 2800-2809 Napoli Dr
- 16 Vestrial Ln
- 537 Crossview Ln
- 416 Chivalry Dr
- 519 Keith St
- 507 Chivalry Dr
- 1013 Blackthorn Ln
- 3 Mooring Ct
- 7 Mooring Ct
- 1 Mooring Ct
- 204 Lick Creek Ln
- 6 Mooring Ct
- 206 Lick Creek Ln
- 4 Mooring Ct
- 2 Mooring Ct
- 11 Chartwell Ct
- 201 Lick Creek Ln
- 12 Chartwell Ct
- 113 Lick Creek Ln
- 9 Chartwell Ct
- 110 Lick Creek Ln
- 109 Lick Creek Ln
- 212 Lick Creek Ln
- 108 Lick Creek Ln
- 10 Chartwell Ct
- 4204 Hampstead Village Dr
- 7 Kings Grant Ct