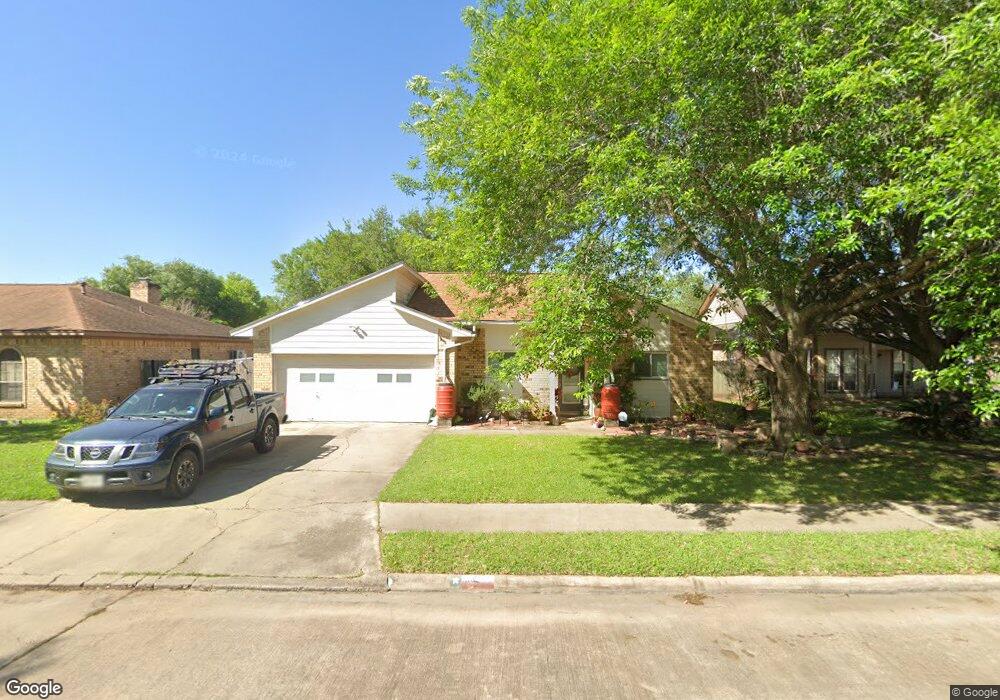
5 Murex St Bay City, TX 77414
Estimated Value: $201,001 - $230,000
3
Beds
2
Baths
1,748
Sq Ft
$125/Sq Ft
Est. Value
About This Home
This home is located at 5 Murex St, Bay City, TX 77414 and is currently estimated at $218,250, approximately $124 per square foot. 5 Murex St is a home located in Matagorda County with nearby schools including John H. Cherry Elementary School, Bay City Junior High School, and Bay City High School.
Ownership History
Date
Name
Owned For
Owner Type
Purchase Details
Closed on
Dec 19, 2017
Sold by
Gamwell Peter Bradford and Nigmatullina Karina
Bought by
Bustos Jose Roberto and Bustos Abelia F
Current Estimated Value
Home Financials for this Owner
Home Financials are based on the most recent Mortgage that was taken out on this home.
Original Mortgage
$169,746
Outstanding Balance
$151,537
Interest Rate
6.6%
Mortgage Type
FHA
Estimated Equity
$66,713
Purchase Details
Closed on
May 31, 2007
Sold by
Williams Kenneth Dale and Williams Suzatte Ann
Bought by
Gamwell Ii Peter Bradford
Home Financials for this Owner
Home Financials are based on the most recent Mortgage that was taken out on this home.
Original Mortgage
$118,000
Interest Rate
6.17%
Mortgage Type
New Conventional
Create a Home Valuation Report for This Property
The Home Valuation Report is an in-depth analysis detailing your home's value as well as a comparison with similar homes in the area
Home Values in the Area
Average Home Value in this Area
Purchase History
| Date | Buyer | Sale Price | Title Company |
|---|---|---|---|
| Bustos Jose Roberto | -- | Bay City Abstract & Title | |
| Gamwell Ii Peter Bradford | -- | -- |
Source: Public Records
Mortgage History
| Date | Status | Borrower | Loan Amount |
|---|---|---|---|
| Open | Bustos Jose Roberto | $169,746 | |
| Previous Owner | Gamwell Ii Peter Bradford | $118,000 |
Source: Public Records
Tax History Compared to Growth
Tax History
| Year | Tax Paid | Tax Assessment Tax Assessment Total Assessment is a certain percentage of the fair market value that is determined by local assessors to be the total taxable value of land and additions on the property. | Land | Improvement |
|---|---|---|---|---|
| 2024 | $52 | $221,040 | $26,640 | $194,400 |
| 2023 | $4,820 | $206,860 | $20,380 | $186,480 |
| 2022 | $5,125 | $191,940 | $10,660 | $181,280 |
| 2021 | $5,234 | $178,180 | $10,660 | $167,520 |
| 2020 | $4,950 | $161,960 | $10,660 | $151,300 |
| 2019 | $4,683 | $153,310 | $10,660 | $142,650 |
| 2018 | $4,224 | $143,370 | $10,660 | $132,710 |
| 2017 | $4,003 | $143,370 | $10,660 | $132,710 |
| 2016 | $3,955 | $141,670 | $10,660 | $131,010 |
| 2015 | -- | $138,200 | $10,660 | $127,540 |
| 2014 | -- | $138,200 | $10,660 | $127,540 |
Source: Public Records
Map
Nearby Homes
- 3 Columbella St
- 2816 La Mesa St
- 2809 La Mesa St
- 3102 La Vista Ave
- 3212 El Camino St
- 2801 Del Monte Ave
- 2616 El Camino St
- 802 Sterling Ct
- 118 Cedar Vale Rd
- 5013 Freedom Ln
- 5000 Freedom Ln
- 5020 Freedom Ln
- 2200 Golden Ave
- 5044 Freedom Ln
- 5028 Freedom Ln
- 5036 Freedom Ln
- 2509 Grace St
- 2505 Grace St
- Pinehollow Plan at Valor Park
- Whitetail Plan at Valor Park