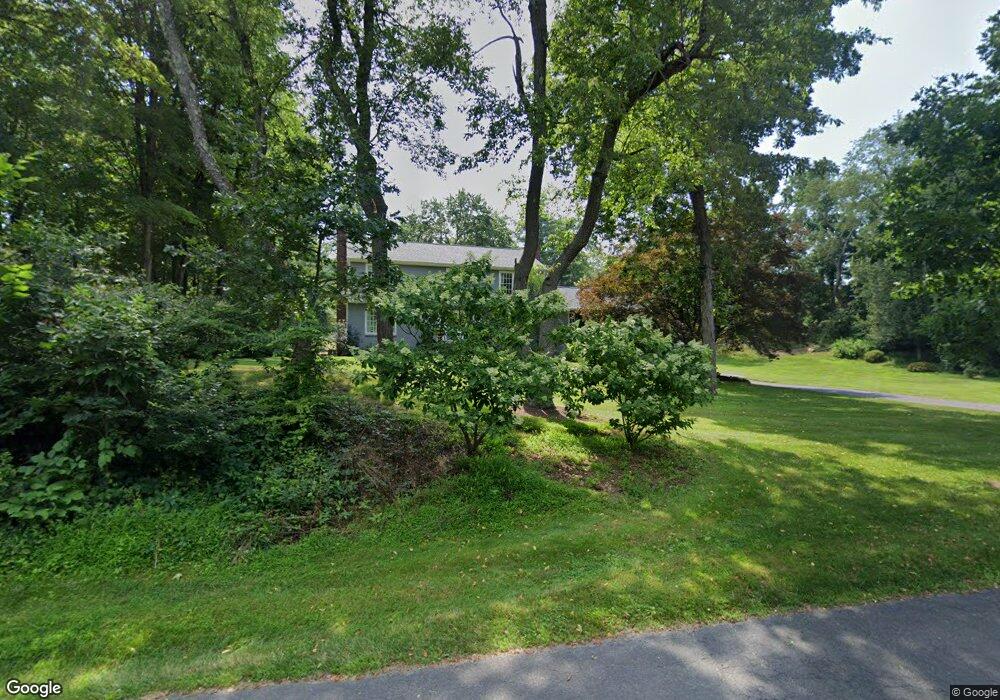
5 Musket Ln Redding, CT 06896
Estimated Value: $976,183 - $1,192,000
4
Beds
4
Baths
3,032
Sq Ft
$355/Sq Ft
Est. Value
About This Home
This home is located at 5 Musket Ln, Redding, CT 06896 and is currently estimated at $1,077,296, approximately $355 per square foot. 5 Musket Ln is a home located in Fairfield County with nearby schools including Redding Elementary School, John Read Middle School, and Joel Barlow High School.
Ownership History
Date
Name
Owned For
Owner Type
Purchase Details
Closed on
Sep 15, 2016
Sold by
Venison Peter J
Bought by
Keenan Sean
Current Estimated Value
Home Financials for this Owner
Home Financials are based on the most recent Mortgage that was taken out on this home.
Original Mortgage
$510,000
Outstanding Balance
$407,368
Interest Rate
3.43%
Mortgage Type
Purchase Money Mortgage
Estimated Equity
$669,928
Purchase Details
Closed on
May 7, 2004
Sold by
Emanvel Henry and Emanvel Carolina
Bought by
Venison Peter
Purchase Details
Closed on
Jul 2, 1996
Sold by
Mrozinski Diane G
Bought by
Emanuel Henry G and Emanuel Carolina M
Home Financials for this Owner
Home Financials are based on the most recent Mortgage that was taken out on this home.
Original Mortgage
$286,400
Interest Rate
8.05%
Mortgage Type
Unknown
Purchase Details
Closed on
Jul 12, 1995
Sold by
Short Harry M and Short Amanda R
Bought by
Mrozinski Diane G
Create a Home Valuation Report for This Property
The Home Valuation Report is an in-depth analysis detailing your home's value as well as a comparison with similar homes in the area
Home Values in the Area
Average Home Value in this Area
Purchase History
| Date | Buyer | Sale Price | Title Company |
|---|---|---|---|
| Keenan Sean | $630,000 | -- | |
| Venison Peter | $690,000 | -- | |
| Emanuel Henry G | $358,000 | -- | |
| Mrozinski Diane G | $330,000 | -- |
Source: Public Records
Mortgage History
| Date | Status | Borrower | Loan Amount |
|---|---|---|---|
| Open | Keenan Sean | $510,000 | |
| Previous Owner | Mrozinski Diane G | $303,400 | |
| Previous Owner | Mrozinski Diane G | $307,950 | |
| Previous Owner | Mrozinski Diane G | $323,000 | |
| Previous Owner | Mrozinski Diane G | $286,400 |
Source: Public Records
Tax History Compared to Growth
Tax History
| Year | Tax Paid | Tax Assessment Tax Assessment Total Assessment is a certain percentage of the fair market value that is determined by local assessors to be the total taxable value of land and additions on the property. | Land | Improvement |
|---|---|---|---|---|
| 2025 | $15,839 | $536,200 | $157,800 | $378,400 |
| 2024 | $15,400 | $536,200 | $157,800 | $378,400 |
| 2023 | $14,847 | $536,200 | $157,800 | $378,400 |
| 2022 | $14,990 | $449,600 | $170,100 | $279,500 |
| 2021 | $14,765 | $449,600 | $170,100 | $279,500 |
| 2020 | $14,469 | $440,600 | $170,100 | $270,500 |
| 2019 | $6,442 | $436,300 | $170,100 | $266,200 |
| 2018 | $13,839 | $436,300 | $170,100 | $266,200 |
| 2017 | $12,902 | $435,600 | $186,000 | $249,600 |
| 2016 | $12,737 | $435,600 | $186,000 | $249,600 |
| 2015 | $12,593 | $435,600 | $186,000 | $249,600 |
| 2014 | $12,593 | $435,600 | $186,000 | $249,600 |
Source: Public Records
Map
Nearby Homes
- 194 Lonetown Rd
- 15 Bartram Dr
- 145 Limekiln Rd
- 2 Longwood Dr
- 28 Sunnyview Dr
- 49 Starr Ln
- 94 Old Stagecoach Rd
- 90 Old Stagecoach Rd
- 173 Chestnut Ridge Rd
- 24 Costa Ln
- 22 Lonetown Rd
- 477 Newtown Turnpike
- 11 Marywood Rd
- 149 Chestnut Ridge Rd
- 118 Sanfordtown Rd
- 12 Canaan Dr
- 56 Cross Hwy
- 241 Black Rock Turnpike
- 134 Nashville Rd
- 74 Wolfpits Rd
- 11 Putnam Park Rd
- 6 Musket Ln
- 27 Putnam Park Rd
- 30 Putnam Park Rd
- 9 Putnam Park Rd
- 9 Putnam Park Rd
- 9 & 11 Putnam Park Rd
- 9&11 Putnam Park Rd
- 37 Putnam Park Rd
- 10 Musket Ln
- 186 Lonetown Rd
- 18 Musket Ln
- 162 Lonetown Rd
- 15 Musket Ln
- 41 Putnam Park Rd
- 45 Putnam Park Rd
- 166 Lonetown Rd
- 184 Lonetown Rd
- 39 Putnam Park Rd
- 172 Lonetown Rd