Estimated Value: $83,000 - $142,000
--
Bed
--
Bath
1,244
Sq Ft
$89/Sq Ft
Est. Value
About This Home
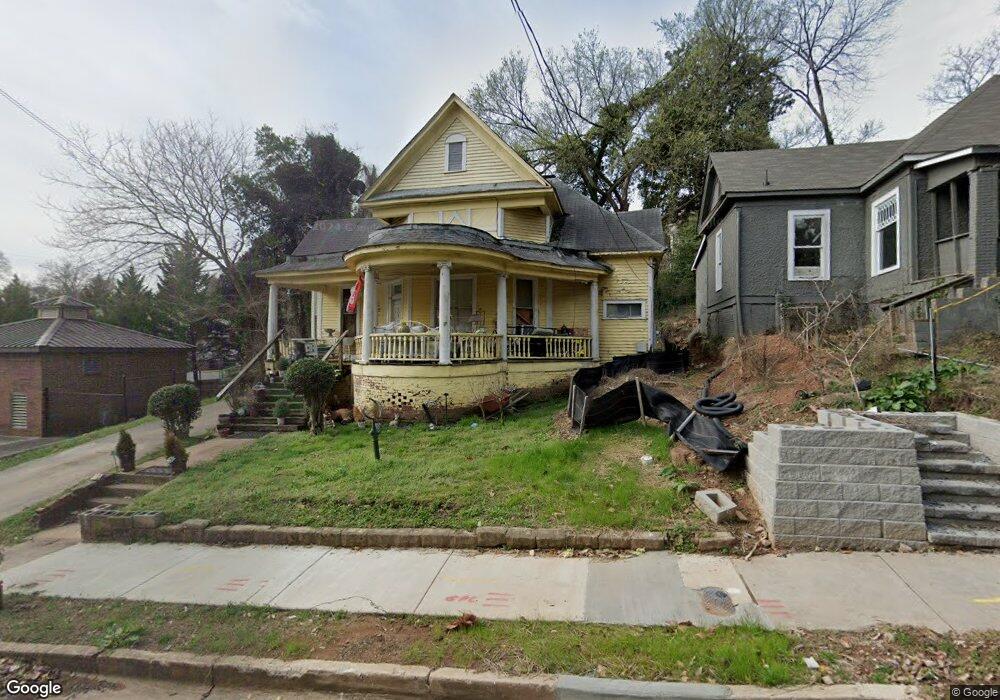
This home is located at 5 Myrtle St SW, Rome, GA 30161 and is currently estimated at $111,082, approximately $89 per square foot. 5 Myrtle St SW is a home located in Floyd County with nearby schools including Dan McCarty Middle School, Rome High School, and Darlington School.
Ownership History
Date
Name
Owned For
Owner Type
Purchase Details
Closed on
Sep 5, 2019
Sold by
Watkins Priscilla R
Bought by
Masters Karen E
Current Estimated Value
Purchase Details
Closed on
Apr 9, 2019
Sold by
Watkins Thomas Elliott
Bought by
Watkins Priscilla Randall
Purchase Details
Closed on
Jun 29, 1979
Sold by
Spikes Spikes M and Spikes Jonnette
Bought by
Watkins Thomas E
Purchase Details
Closed on
Sep 3, 1975
Sold by
Hice Grady and Hice Lucille
Bought by
Spikes Spikes M and Spikes Jonnette
Purchase Details
Closed on
Jan 15, 1969
Sold by
Hicks Hicks J and Hicks Velma
Bought by
Hice Grady and Hice Lucille
Purchase Details
Closed on
Jul 24, 1967
Sold by
Butler Const Co
Bought by
Hicks Hicks J and Hicks Velma
Purchase Details
Closed on
Jun 27, 1967
Sold by
Sutton Zack and Sutton Zaddie B
Bought by
Butler Const Co
Purchase Details
Closed on
Sep 24, 1963
Sold by
Collins J J
Bought by
Sutton Zack and Sutton Zaddie B
Purchase Details
Closed on
Jan 1, 1901
Bought by
Collins J J
Create a Home Valuation Report for This Property
The Home Valuation Report is an in-depth analysis detailing your home's value as well as a comparison with similar homes in the area
Home Values in the Area
Average Home Value in this Area
Purchase History
| Date | Buyer | Sale Price | Title Company |
|---|---|---|---|
| Masters Karen E | $23,000 | -- | |
| Watkins Priscilla Randall | -- | -- | |
| Watkins Thomas E | $20,100 | -- | |
| Spikes Spikes M | $6,000 | -- | |
| Hice Grady | $1,000 | -- | |
| Hicks Hicks J | -- | -- | |
| Butler Const Co | $4,000 | -- | |
| Sutton Zack | $6,500 | -- | |
| Collins J J | -- | -- |
Source: Public Records
Tax History Compared to Growth
Tax History
| Year | Tax Paid | Tax Assessment Tax Assessment Total Assessment is a certain percentage of the fair market value that is determined by local assessors to be the total taxable value of land and additions on the property. | Land | Improvement |
|---|---|---|---|---|
| 2024 | $1,094 | $28,084 | $4,866 | $23,218 |
| 2023 | $995 | $26,658 | $4,423 | $22,235 |
| 2022 | $666 | $18,242 | $3,538 | $14,704 |
| 2021 | $616 | $16,598 | $3,538 | $13,060 |
| 2020 | $562 | $15,016 | $2,764 | $12,252 |
| 2019 | $526 | $14,207 | $2,764 | $11,443 |
| 2018 | $495 | $13,385 | $2,764 | $10,621 |
| 2017 | $478 | $12,897 | $2,764 | $10,133 |
| 2016 | $466 | $12,557 | $2,760 | $9,797 |
| 2015 | $440 | $12,557 | $2,760 | $9,797 |
| 2014 | $440 | $12,557 | $2,760 | $9,797 |
Source: Public Records
Map
Nearby Homes
- 105 Mary St SW
- 232 S Broad St SW
- 110 Cherokee St SW
- 235 Pennington Ave SW
- 204 Myrtle St SW
- 334 Branham Ave SW
- 101 Hardy Ave SW
- 107 Butler St SW
- 515 S Broad St SW
- 515 Harper Ave SW
- 3 Grover St SW
- 115 Lookout Cir SW
- 113 Lookout Cir SW
- 410 Hardy Ave SW
- 111 Lookout Cir SW
- 8 E 3rd Ave
- 10 E 3rd Ave
- 218 Wilson Ave SW
- 515 Hardy Ave SW
- 7 Myrtle St SW
- 9 Klassing St SW
- 7 Klassing St SW
- 200 & 32 Myrtle St Pennington Ave SW
- 5 Klassing St SW
- 73 Klassing St SW
- 11 Myrtle St SW
- 200 Broad St Unit 201
- 3 Klassing St SW
- 77 Klassing St SW
- 75 Klassing St SW
- 77 Klassing St SW
- 13 Myrtle St SW
- 12 Klassing St SW
- 210 S Broad St SW
- 81 Klassing St SW
- 10 Klassing St SW
- 8 Klassing St SW
- 6 Klassing St SW
- 4 Klassing St SW