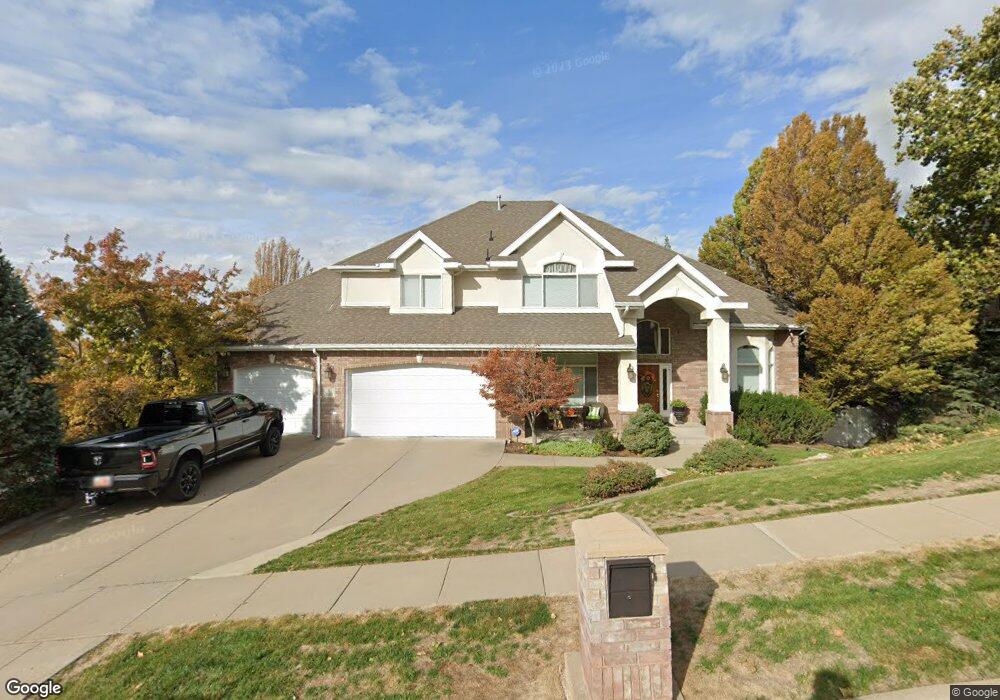
5 N 1375 E Bountiful, UT 84010
Estimated Value: $736,000 - $1,043,000
6
Beds
4
Baths
5,137
Sq Ft
$181/Sq Ft
Est. Value
About This Home
This home is located at 5 N 1375 E, Bountiful, UT 84010 and is currently estimated at $930,881, approximately $181 per square foot. 5 N 1375 E is a home located in Davis County with nearby schools including Oak Hills School, Millcreek Junior High School, and Bountiful High School.
Ownership History
Date
Name
Owned For
Owner Type
Purchase Details
Closed on
Mar 21, 2002
Sold by
Grasteit John E and Grasteit Carrie V
Bought by
Haslam Mark C and Haslam Terri
Current Estimated Value
Home Financials for this Owner
Home Financials are based on the most recent Mortgage that was taken out on this home.
Original Mortgage
$335,000
Outstanding Balance
$137,771
Interest Rate
6.84%
Estimated Equity
$793,110
Purchase Details
Closed on
Jul 31, 1997
Sold by
Grasteit John E and Grasteit Carrie
Bought by
Grasteit John E and Grasteit Carrie
Home Financials for this Owner
Home Financials are based on the most recent Mortgage that was taken out on this home.
Original Mortgage
$230,000
Interest Rate
7.57%
Purchase Details
Closed on
May 31, 1996
Sold by
Crist Neil B
Bought by
Grasteit John E and Grasteit Carrie
Home Financials for this Owner
Home Financials are based on the most recent Mortgage that was taken out on this home.
Original Mortgage
$144,500
Interest Rate
7.97%
Create a Home Valuation Report for This Property
The Home Valuation Report is an in-depth analysis detailing your home's value as well as a comparison with similar homes in the area
Purchase History
| Date | Buyer | Sale Price | Title Company |
|---|---|---|---|
| Haslam Mark C | -- | Bonneville Title Company Inc | |
| Grasteit John E | -- | American Legal Title Ins | |
| Grasteit John E | -- | Associated Title Company |
Source: Public Records
Mortgage History
| Date | Status | Borrower | Loan Amount |
|---|---|---|---|
| Open | Haslam Mark C | $335,000 | |
| Previous Owner | Grasteit John E | $230,000 | |
| Previous Owner | Grasteit John E | $144,500 |
Source: Public Records
Tax History
| Year | Tax Paid | Tax Assessment Tax Assessment Total Assessment is a certain percentage of the fair market value that is determined by local assessors to be the total taxable value of land and additions on the property. | Land | Improvement |
|---|---|---|---|---|
| 2025 | $5,293 | $492,250 | $113,967 | $378,283 |
| 2024 | $4,891 | $467,499 | $104,850 | $362,649 |
| 2023 | $4,818 | $459,800 | $106,206 | $353,593 |
| 2022 | $4,885 | $845,000 | $187,719 | $657,281 |
| 2021 | $4,537 | $662,000 | $153,710 | $508,290 |
| 2020 | $4,046 | $586,000 | $147,257 | $438,743 |
| 2019 | $3,971 | $561,000 | $138,137 | $422,863 |
| 2018 | $3,806 | $530,000 | $129,242 | $400,758 |
| 2016 | $3,479 | $263,340 | $59,516 | $203,824 |
| 2015 | $3,451 | $246,840 | $59,516 | $187,324 |
| 2014 | $3,163 | $231,513 | $59,516 | $171,997 |
| 2013 | -- | $224,897 | $66,078 | $158,819 |
Source: Public Records
Map
Nearby Homes
- 1138 Briggs Dr
- 144 Bountiful Blvd
- 331 S 1550 E Unit 3
- 111 Eagle Ridge Dr
- 1342 E Skyline Dr N Unit 30
- 6 N 800 E
- 908 Northern Hills Dr Unit 3
- 129 N 800 E
- 0 Lot Bountiful Blvd
- 933 Northern Hills Cir
- 683 E 100 N
- 861 E Millbrook Way
- 456 E 500 S
- 513 N 400 E Unit 14B
- 520 S Orchard Dr Unit 17
- 795 Abby Ln Unit 5
- 775 E 1500 S
- 453 N 400 E Unit 7-D
- 1596 E Millbrook Way
- 323 Peach Ln
- 1345 Vineyard Dr
- 101 N 1375 E
- 1379 Vineyard Dr
- 1356 Vineyard Dr
- 1376 Vineyard Dr
- 1329 Vineyard Dr
- 1342 Vineyard Dr
- 92 N 1375 E
- 1399 Vineyard Dr
- 1328 Vineyard Dr
- 44 N 1300 E
- 1384 Vineyard Dr
- 90 N 1300 E
- 1405 Vineyard Dr
- 1343 Seville Way
- 1405 E Center St
- 1413 E Center St
- 1403 Vineyard Dr
- 1312 E 250 N Unit 2
- 1314 Vineyard Dr
Your Personal Tour Guide
Ask me questions while you tour the home.