Estimated Value: $244,000 - $296,344
3
Beds
2
Baths
1,804
Sq Ft
$147/Sq Ft
Est. Value
About This Home
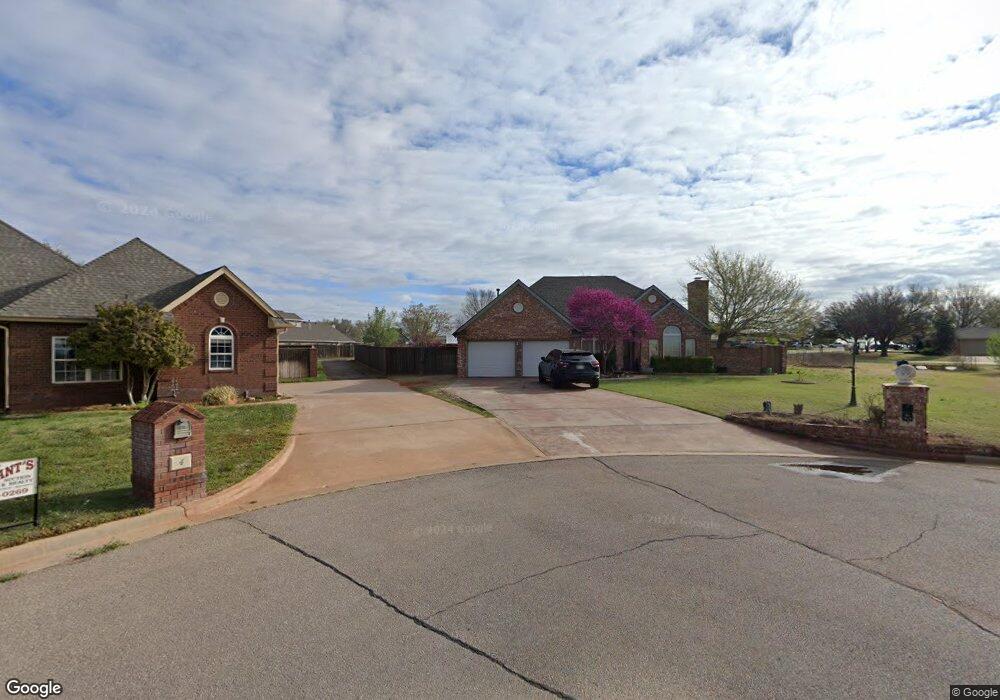
This home is located at 5 N Covey St, Sayre, OK 73662 and is currently estimated at $266,086, approximately $147 per square foot. 5 N Covey St is a home located in Beckham County with nearby schools including Sayre Elementary School, Sayre Middle School, and Sayre High School.
Ownership History
Date
Name
Owned For
Owner Type
Purchase Details
Closed on
Dec 1, 2012
Sold by
Hill Darrell Ray and Hill Darrell R
Bought by
Hill Alicia Kay and Hill Alicia K
Current Estimated Value
Purchase Details
Closed on
Jan 3, 2006
Sold by
Jones Rex E and Jones Cindy D
Bought by
Hill Darrell and Hill Alicia
Home Financials for this Owner
Home Financials are based on the most recent Mortgage that was taken out on this home.
Original Mortgage
$136,000
Outstanding Balance
$76,352
Interest Rate
6.25%
Mortgage Type
New Conventional
Estimated Equity
$189,734
Purchase Details
Closed on
Nov 30, 2001
Sold by
Bain
Bought by
Jones
Purchase Details
Closed on
Jun 11, 1998
Sold by
Rizley
Bought by
Bain
Create a Home Valuation Report for This Property
The Home Valuation Report is an in-depth analysis detailing your home's value as well as a comparison with similar homes in the area
Home Values in the Area
Average Home Value in this Area
Purchase History
| Date | Buyer | Sale Price | Title Company |
|---|---|---|---|
| Hill Alicia Kay | -- | None Available | |
| Hill Darrell | $145,000 | None Available | |
| Jones | $120,000 | -- | |
| Bain | $130,000 | -- |
Source: Public Records
Mortgage History
| Date | Status | Borrower | Loan Amount |
|---|---|---|---|
| Open | Hill Darrell | $136,000 |
Source: Public Records
Tax History Compared to Growth
Tax History
| Year | Tax Paid | Tax Assessment Tax Assessment Total Assessment is a certain percentage of the fair market value that is determined by local assessors to be the total taxable value of land and additions on the property. | Land | Improvement |
|---|---|---|---|---|
| 2024 | $1,905 | $24,419 | $3,913 | $20,506 |
| 2023 | $1,914 | $24,539 | $2,609 | $21,930 |
| 2022 | $1,858 | $23,824 | $2,609 | $21,215 |
| 2021 | $1,840 | $23,131 | $2,609 | $20,522 |
| 2020 | $1,840 | $22,551 | $2,609 | $19,942 |
| 2019 | $1,817 | $22,342 | $1,648 | $20,694 |
| 2018 | $1,758 | $21,692 | $1,648 | $20,044 |
| 2017 | $1,712 | $21,060 | $1,648 | $19,412 |
| 2016 | $1,662 | $20,447 | $1,648 | $18,799 |
| 2015 | $1,462 | $19,851 | $1,648 | $18,203 |
| 2014 | $1,389 | $19,273 | $1,648 | $17,625 |
Source: Public Records
Map
Nearby Homes
- 418 N Electra St
- 604 Konner Cir
- 705 E Leverett Ave
- 0 N 1st St
- 314 E Lincoln Ave
- 902 N Broadway St
- 406 N 4th St
- 626 E Benton Ave
- 310 N 4th St
- 603 E Benton Ave
- 613 N 4th St
- 1302 N 3rd St
- 1001 N 4th St
- 411 N 5th St
- 412 E Washington Ave
- 1501 N Wade St
- 119 E Greer Ave
- 1314 N Broadway St
- 819 N 6th St
- 305 W Cedar Ave