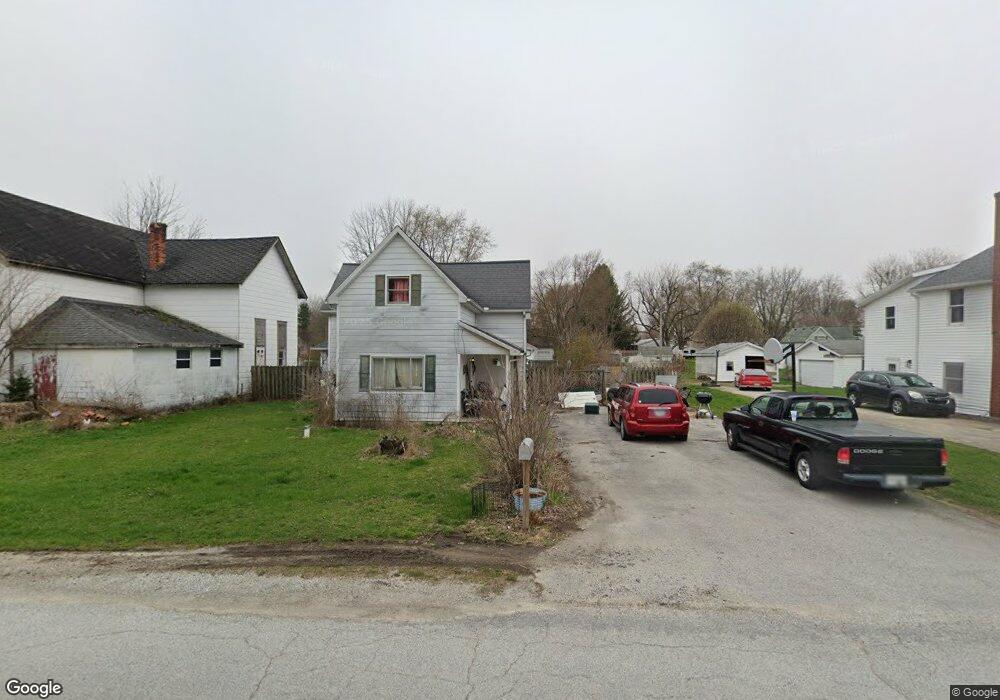
5 N Main St Sims, IN 46986
Estimated Value: $118,000 - $154,000
3
Beds
1
Bath
1,636
Sq Ft
$84/Sq Ft
Est. Value
About This Home
This home is located at 5 N Main St, Sims, IN 46986 and is currently estimated at $137,546, approximately $84 per square foot. 5 N Main St is a home located in Grant County with nearby schools including Converse Elementary School, Sweetser Elementary School, and Swayzee Elementary School.
Ownership History
Date
Name
Owned For
Owner Type
Purchase Details
Closed on
Dec 10, 2015
Sold by
Tucci Brian
Bought by
Trusty James and Trusty Shawnna
Current Estimated Value
Purchase Details
Closed on
Jan 14, 2010
Sold by
Fannie Mae
Bought by
Tucci Brian and Tucci Karyn
Purchase Details
Closed on
Oct 8, 2009
Sold by
Yeakle Gregory D and Gmac Mortgage Llc
Bought by
Fannie Mae and Federal National Mortgage Association
Create a Home Valuation Report for This Property
The Home Valuation Report is an in-depth analysis detailing your home's value as well as a comparison with similar homes in the area
Home Values in the Area
Average Home Value in this Area
Purchase History
| Date | Buyer | Sale Price | Title Company |
|---|---|---|---|
| Trusty James | $50,000 | -- | |
| Tucci Brian | $15,000 | None Available | |
| Fannie Mae | $34,348 | None Available |
Source: Public Records
Mortgage History
| Date | Status | Borrower | Loan Amount |
|---|---|---|---|
| Closed | Tucci Brian | $0 |
Source: Public Records
Tax History Compared to Growth
Tax History
| Year | Tax Paid | Tax Assessment Tax Assessment Total Assessment is a certain percentage of the fair market value that is determined by local assessors to be the total taxable value of land and additions on the property. | Land | Improvement |
|---|---|---|---|---|
| 2024 | $369 | $65,800 | $12,700 | $53,100 |
| 2023 | $361 | $62,700 | $12,700 | $50,000 |
| 2022 | $421 | $59,300 | $16,700 | $42,600 |
| 2021 | $445 | $55,400 | $16,700 | $38,700 |
| 2020 | $437 | $56,500 | $16,700 | $39,800 |
| 2019 | $436 | $60,000 | $16,700 | $43,300 |
| 2018 | $445 | $65,600 | $15,400 | $50,200 |
| 2017 | $1,011 | $66,000 | $15,400 | $50,600 |
| 2016 | $919 | $66,000 | $15,400 | $50,600 |
| 2014 | $882 | $66,300 | $14,500 | $51,800 |
| 2013 | $882 | $65,100 | $14,500 | $50,600 |
Source: Public Records
Map
Nearby Homes
- 105 N Main St
- 109 S Main St
- 207 W Lincoln St
- 207 W Marks St
- 606 S Sims St
- 6659 W 400 S
- 71 S 1100 E
- 9420 W North 00 S 27
- 8011 S 800 W
- 1252 S 600 W
- 9502 W 800 S
- 9391 E 100 N
- 36 Howard St
- 8898,8924,8948 E 100 N
- 1125 Robin Ct
- 105 W Wabash St
- 1009 Eastcrest Dr
- 106 W Water St
- 524 E Grant St
- 7405 W Mier 27