Estimated Value: $338,000 - $434,000
--
Bed
3
Baths
2,876
Sq Ft
$133/Sq Ft
Est. Value
About This Home
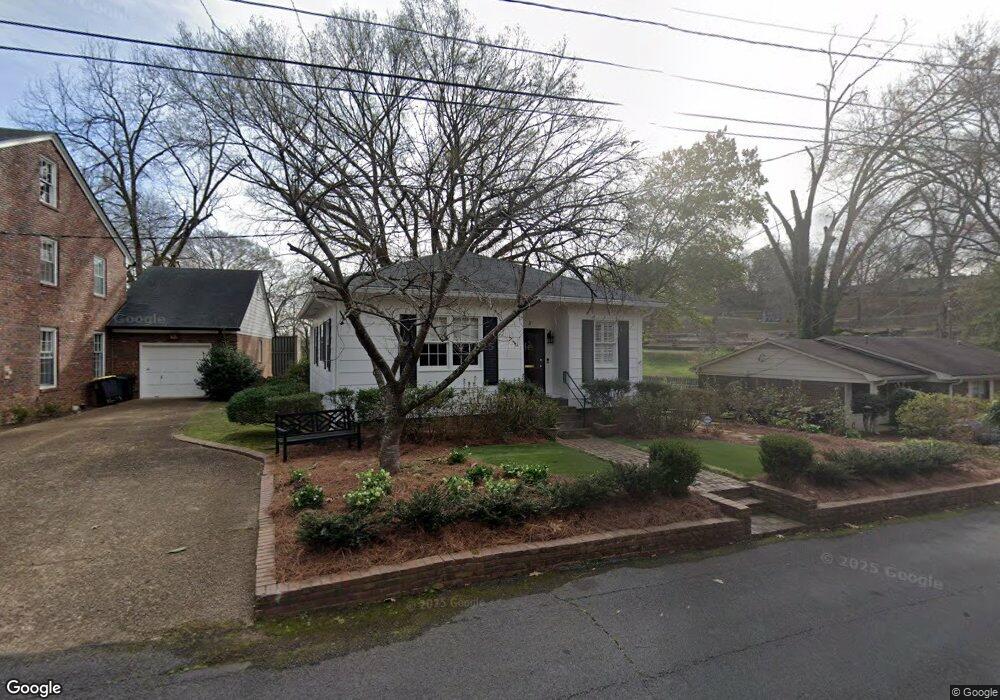
This home is located at 5 N Pennington Ave SW, Rome, GA 30161 and is currently estimated at $382,943, approximately $133 per square foot. 5 N Pennington Ave SW is a home located in Floyd County with nearby schools including Dan McCarty Middle School, Rome High School, and Darlington School.
Ownership History
Date
Name
Owned For
Owner Type
Purchase Details
Closed on
Apr 30, 2021
Sold by
Shaw Julius
Bought by
H Investments Llc
Current Estimated Value
Purchase Details
Closed on
May 29, 2018
Sold by
High Lee K
Bought by
Shaw Wendy and Shaw Julius
Purchase Details
Closed on
Apr 18, 2008
Sold by
Not Provided
Bought by
Kimbrell Esther M
Purchase Details
Closed on
Aug 5, 1976
Sold by
Kimbrell Chas A and Kimbrell Ester
Bought by
Miller Kimbrell
Purchase Details
Closed on
Nov 16, 1964
Sold by
Howell Adrian
Bought by
Howell Pearl W
Purchase Details
Closed on
Apr 29, 1964
Bought by
P and R
Purchase Details
Closed on
Apr 28, 1964
Sold by
Mccord Ralph B
Bought by
Howell Adrian
Purchase Details
Closed on
Sep 1, 1963
Sold by
Love Grace (Mrs)
Bought by
Mccord Ralph B
Purchase Details
Closed on
Jan 1, 1901
Bought by
Love Grace (Mrs)
Create a Home Valuation Report for This Property
The Home Valuation Report is an in-depth analysis detailing your home's value as well as a comparison with similar homes in the area
Home Values in the Area
Average Home Value in this Area
Purchase History
| Date | Buyer | Sale Price | Title Company |
|---|---|---|---|
| H Investments Llc | $272,000 | -- | |
| Shaw Wendy | -- | -- | |
| Shaw Wendy | -- | -- | |
| Shaw10 Wendy | $205,000 | -- | |
| Kimbrell Esther M | -- | -- | |
| Kimbrell Esther M | -- | -- | |
| Miller Kimbrell | -- | -- | |
| Howell Pearl W | -- | -- | |
| P | -- | -- | |
| Howell Adrian | -- | -- | |
| Mccord Ralph B | $4,500 | -- | |
| Love Grace (Mrs) | -- | -- |
Source: Public Records
Tax History Compared to Growth
Tax History
| Year | Tax Paid | Tax Assessment Tax Assessment Total Assessment is a certain percentage of the fair market value that is determined by local assessors to be the total taxable value of land and additions on the property. | Land | Improvement |
|---|---|---|---|---|
| 2024 | $5,122 | $134,203 | $5,322 | $128,881 |
| 2023 | $4,753 | $121,542 | $4,657 | $116,885 |
| 2022 | $3,708 | $101,609 | $3,770 | $97,839 |
| 2021 | $3,434 | $92,551 | $3,770 | $88,781 |
| 2020 | $3,281 | $87,688 | $2,883 | $84,805 |
| 2019 | $3,035 | $83,536 | $2,883 | $80,653 |
| 2018 | $1,220 | $58,360 | $2,883 | $55,477 |
| 2017 | $1,178 | $55,919 | $2,883 | $53,036 |
| 2016 | $1,153 | $54,206 | $2,880 | $51,326 |
| 2015 | -- | $54,206 | $2,880 | $51,326 |
| 2014 | -- | $54,206 | $2,880 | $51,326 |
Source: Public Records
Map
Nearby Homes
- 204 Myrtle St SW
- 101 Hardy Ave SW
- 105 Mary St SW
- 110 Cherokee St SW
- 334 Branham Ave SW
- 232 S Broad St SW
- 8 E 3rd Ave
- 10 E 3rd Ave
- 218 Wilson Ave SW
- 6 Horseleg Creek Rd SW
- 18 Butler St SW
- 1005 N 2nd Ave NW
- 1005 N 2nd Ave NW Unit 31
- 410 Hardy Ave SW
- 107 Butler St SW
- Lot #1 Martha Berry Hwy
- 214 E 3rd St
- 715 Avenue A NE
- 3 Grover St SW
- 202 E 4th Ave Unit 5
- 5 N Pennington Ave SW
- 3 N Pennington Ave SW
- 7 N Pennington Ave SW
- 7 N Pennington Ave SW
- 7 N Pennington Ave SW
- 7 N Pennington Ave
- N N Pennington Ave
- 100 Branham Ave SW
- 124 Branham Ave SW
- 11 Pennington Ave SW
- 13 Pennington Ave SW
- 15 Pennington Ave SW
- 119 Branham Ave SW
- 121 Branham Ave SW
- 123 Branham Ave SW
- 125 Branham Ave SW
- 2 Virginia Cir SW
- 203 Branham Ave SW
- 20 Pennington Ave SW
- 4 Virginia Cir SW