5 Nancy Dr Plymouth, MA 02360
Estimated Value: $594,000 - $602,000
3
Beds
2
Baths
2,047
Sq Ft
$293/Sq Ft
Est. Value
About This Home
This home is located at 5 Nancy Dr, Plymouth, MA 02360 and is currently estimated at $599,100, approximately $292 per square foot. 5 Nancy Dr is a home located in Plymouth County with nearby schools including South Elementary School, Plymouth South Middle School, and Plymouth South High School.
Ownership History
Date
Name
Owned For
Owner Type
Purchase Details
Closed on
Sep 11, 2008
Sold by
Citi Res Lending Inc and Deutsche Bank Natl T C
Bought by
Kirby Matthew and Kirby Stacy
Current Estimated Value
Home Financials for this Owner
Home Financials are based on the most recent Mortgage that was taken out on this home.
Original Mortgage
$169,600
Interest Rate
6.58%
Mortgage Type
Purchase Money Mortgage
Purchase Details
Closed on
Mar 17, 2008
Sold by
Moriarty Kristen R and Moriarty Joseph M
Bought by
Deutsche Bank Natl T C
Purchase Details
Closed on
Oct 18, 2004
Sold by
Moriarty Joseph M and Moriarty Kristen R
Bought by
Moriarty Joseph M and Moriarty Kristen R
Purchase Details
Closed on
Nov 22, 1988
Sold by
Canevazzi Robert F
Bought by
Moriarty Joseph M
Create a Home Valuation Report for This Property
The Home Valuation Report is an in-depth analysis detailing your home's value as well as a comparison with similar homes in the area
Home Values in the Area
Average Home Value in this Area
Purchase History
| Date | Buyer | Sale Price | Title Company |
|---|---|---|---|
| Kirby Matthew | $261,900 | -- | |
| Deutsche Bank Natl T C | $317,307 | -- | |
| Moriarty Joseph M | -- | -- | |
| Moriarty Joseph M | $119,000 | -- |
Source: Public Records
Mortgage History
| Date | Status | Borrower | Loan Amount |
|---|---|---|---|
| Open | Moriarty Joseph M | $198,412 | |
| Closed | Moriarty Joseph M | $169,600 |
Source: Public Records
Tax History Compared to Growth
Tax History
| Year | Tax Paid | Tax Assessment Tax Assessment Total Assessment is a certain percentage of the fair market value that is determined by local assessors to be the total taxable value of land and additions on the property. | Land | Improvement |
|---|---|---|---|---|
| 2025 | $6,210 | $489,400 | $228,800 | $260,600 |
| 2024 | $6,066 | $471,300 | $217,800 | $253,500 |
| 2023 | $5,931 | $432,600 | $198,000 | $234,600 |
| 2022 | $5,683 | $368,300 | $187,000 | $181,300 |
| 2021 | $5,548 | $343,300 | $187,000 | $156,300 |
| 2020 | $5,405 | $330,600 | $176,000 | $154,600 |
| 2019 | $5,586 | $337,700 | $181,300 | $156,400 |
| 2018 | $4,875 | $296,200 | $140,000 | $156,200 |
| 2017 | $4,632 | $279,400 | $140,000 | $139,400 |
| 2016 | $4,406 | $270,800 | $130,000 | $140,800 |
| 2015 | $3,994 | $257,000 | $115,000 | $142,000 |
| 2014 | $3,825 | $252,800 | $115,000 | $137,800 |
Source: Public Records
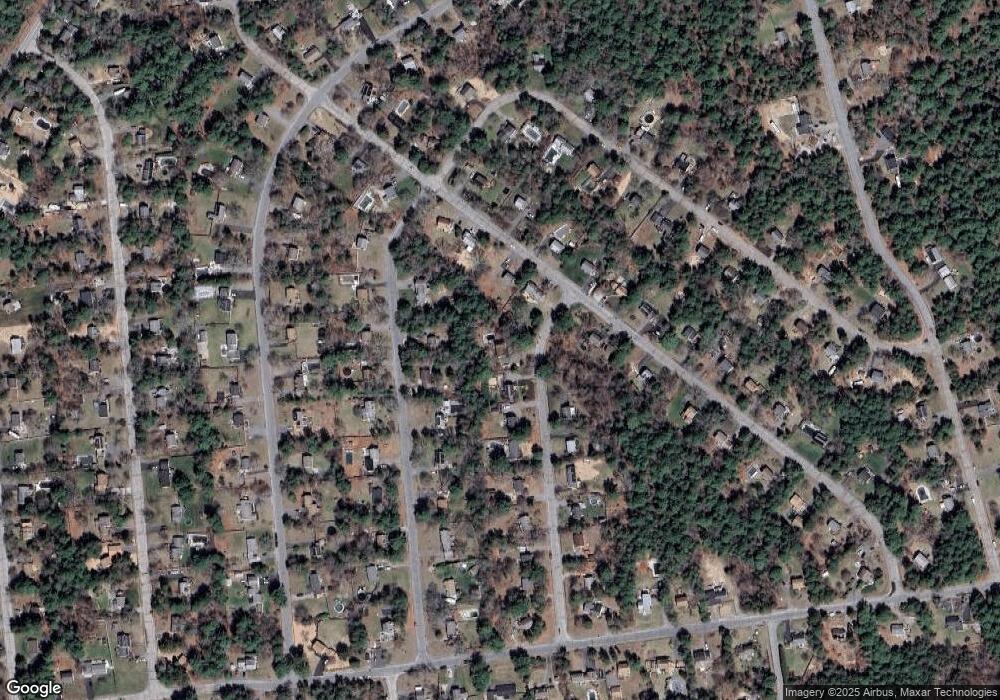
Map
Nearby Homes
- 37 Sandra Way
- 42 Stockade Path
- 1 Maureen Way
- 28 Victory Ln
- 0 Bourne Rd
- 196 Bourne Rd
- 879 Long Pond Rd
- 885 Long Pond Rd
- 45 Plaza Way Unit 406
- 0 Wareham Rd
- 671 Lunns Way
- 11 Trumpet Vine Ln
- 12 Tradewind Ln
- 21 Daisy Ln
- 97 Sunflower Way
- 242 Hedges Pond Rd
- 33 Seabiscuit Dr
- 20 Towering Trees Rd
- 017-011 Seabiscuit Dr
- 017-035 Seabiscuit Dr