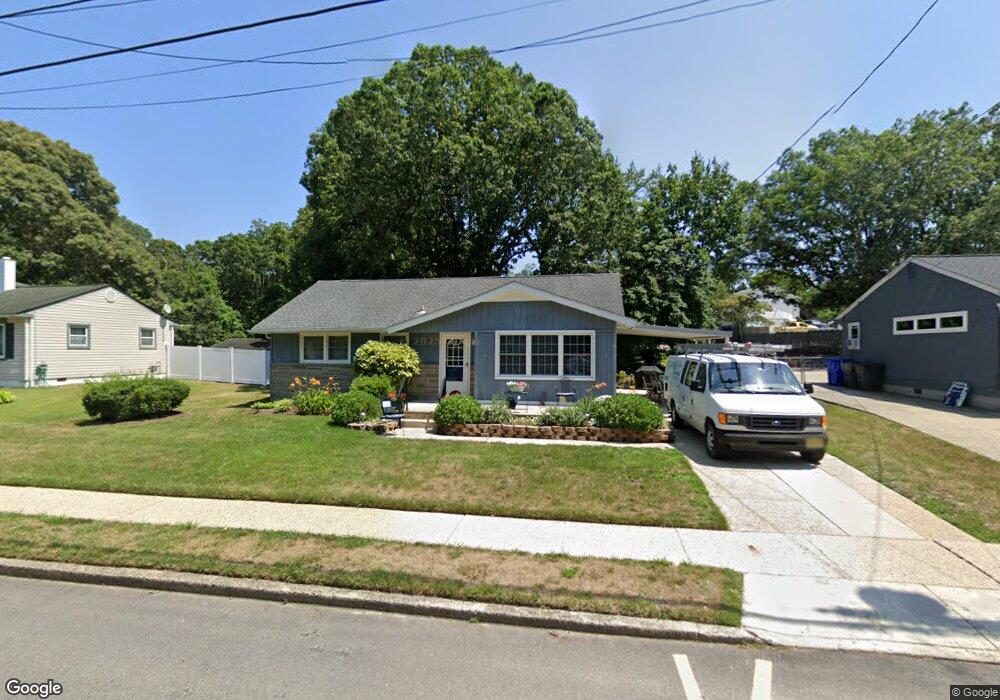
5 Nassau Rd Somers Point, NJ 08244
Estimated Value: $294,000 - $312,000
--
Bed
--
Bath
964
Sq Ft
$316/Sq Ft
Est. Value
About This Home
This home is located at 5 Nassau Rd, Somers Point, NJ 08244 and is currently estimated at $304,712, approximately $316 per square foot. 5 Nassau Rd is a home located in Atlantic County with nearby schools including Mainland Regional High School, ChARTer TECH High School for the Performing Arts, and Saint Joseph Regional School.
Ownership History
Date
Name
Owned For
Owner Type
Purchase Details
Closed on
Dec 10, 1996
Sold by
Kimmins Paul J and Kimmins Eileen C
Bought by
Wyner James M and Wyner Ann
Current Estimated Value
Home Financials for this Owner
Home Financials are based on the most recent Mortgage that was taken out on this home.
Original Mortgage
$75,200
Outstanding Balance
$7,678
Interest Rate
7.75%
Estimated Equity
$297,034
Purchase Details
Closed on
Jul 8, 1995
Sold by
Kimmins Paul J and Kimmins Brendan C
Bought by
Kimmins Paul J and Kimmins Eileen C
Purchase Details
Closed on
Dec 20, 1994
Sold by
Kimmins Paul J and Kimmins Eileen C
Bought by
Kimmins Paul J and Kimmins Brendan C
Create a Home Valuation Report for This Property
The Home Valuation Report is an in-depth analysis detailing your home's value as well as a comparison with similar homes in the area
Home Values in the Area
Average Home Value in this Area
Purchase History
| Date | Buyer | Sale Price | Title Company |
|---|---|---|---|
| Wyner James M | $94,000 | The Title Company | |
| Kimmins Paul J | -- | -- | |
| Kimmins Paul J | -- | -- |
Source: Public Records
Mortgage History
| Date | Status | Borrower | Loan Amount |
|---|---|---|---|
| Open | Wyner James M | $75,200 |
Source: Public Records
Tax History Compared to Growth
Tax History
| Year | Tax Paid | Tax Assessment Tax Assessment Total Assessment is a certain percentage of the fair market value that is determined by local assessors to be the total taxable value of land and additions on the property. | Land | Improvement |
|---|---|---|---|---|
| 2025 | $5,260 | $147,100 | $68,600 | $78,500 |
| 2024 | $5,260 | $147,100 | $68,600 | $78,500 |
| 2023 | $4,915 | $147,100 | $68,600 | $78,500 |
| 2022 | $4,915 | $147,100 | $68,600 | $78,500 |
| 2021 | $4,841 | $147,100 | $68,600 | $78,500 |
| 2020 | $4,743 | $147,100 | $68,600 | $78,500 |
| 2019 | $4,609 | $147,100 | $68,600 | $78,500 |
| 2018 | $4,579 | $149,300 | $68,600 | $80,700 |
| 2017 | $4,415 | $149,300 | $68,600 | $80,700 |
| 2016 | $4,215 | $149,300 | $68,600 | $80,700 |
| 2015 | $4,171 | $149,300 | $68,600 | $80,700 |
| 2014 | $4,031 | $149,300 | $68,600 | $80,700 |
Source: Public Records
Map
Nearby Homes
- 7 Nassau Rd
- 9 Nassau Rd
- 604 9th St
- 901 W New York Ave
- 120 Jordan Rd
- 1009 Massachusetts Ave
- 36 Lehigh Dr
- 715 Massachusetts Ave
- 710 W New York Ave
- 426 7th St
- 101 Haddon Rd
- 6 Colgate Rd
- 19 Merion Dr
- 100 Colwick Dr
- 12 Cornell Rd
- 653 4th St
- 15 Yale Blvd
- 322 W Connecticut Ave Unit A
- 745 5th St
- 303 Garden Terrace