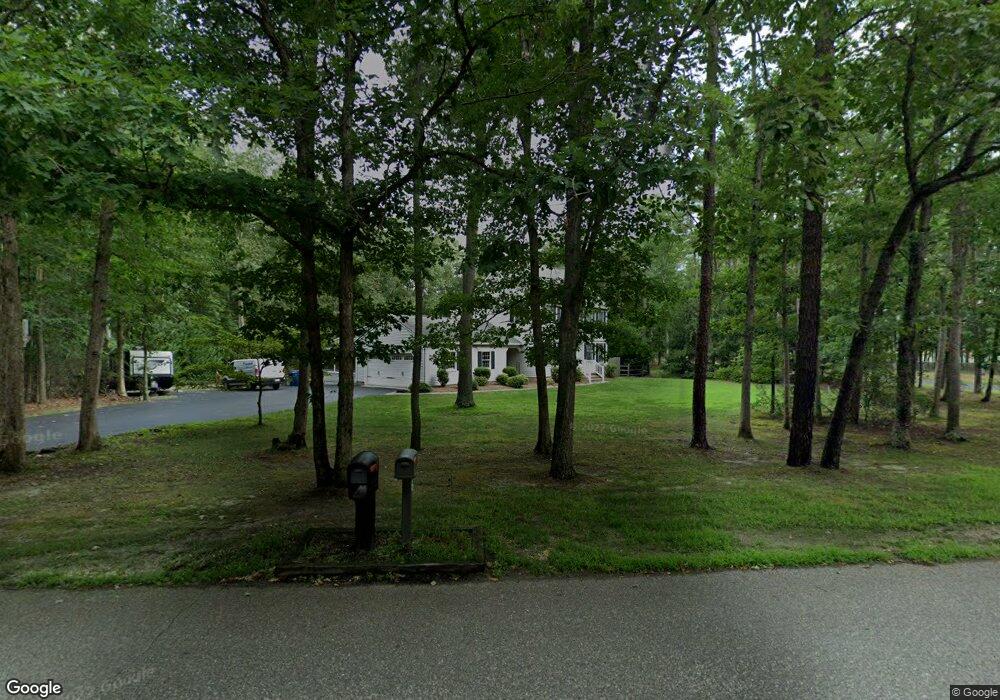
5 Oak Dr Tabernacle, NJ 08088
Estimated Value: $534,000 - $598,000
3
Beds
2
Baths
2,270
Sq Ft
$249/Sq Ft
Est. Value
About This Home
This home is located at 5 Oak Dr, Tabernacle, NJ 08088 and is currently estimated at $565,576, approximately $249 per square foot. 5 Oak Dr is a home located in Burlington County with nearby schools including Tabernacle Elementary School, Kenneth R Olson Mid School, and Shawnee High School.
Ownership History
Date
Name
Owned For
Owner Type
Purchase Details
Closed on
Aug 19, 2010
Sold by
Mclaughlin Julianne R and Mclaughlin Stephanie L
Bought by
Brooks Daniel N and Brooks Theresa
Current Estimated Value
Home Financials for this Owner
Home Financials are based on the most recent Mortgage that was taken out on this home.
Original Mortgage
$216,000
Outstanding Balance
$142,363
Interest Rate
4.48%
Mortgage Type
Stand Alone First
Estimated Equity
$423,213
Purchase Details
Closed on
Mar 21, 2009
Sold by
Hodgens Mary
Bought by
Mclaughlin Julianne R and Mclaughlin Stephanie L
Create a Home Valuation Report for This Property
The Home Valuation Report is an in-depth analysis detailing your home's value as well as a comparison with similar homes in the area
Home Values in the Area
Average Home Value in this Area
Purchase History
| Date | Buyer | Sale Price | Title Company |
|---|---|---|---|
| Brooks Daniel N | $270,000 | Weichert Title Agency | |
| Mclaughlin Julianne R | -- | None Available |
Source: Public Records
Mortgage History
| Date | Status | Borrower | Loan Amount |
|---|---|---|---|
| Open | Brooks Daniel N | $216,000 |
Source: Public Records
Tax History
| Year | Tax Paid | Tax Assessment Tax Assessment Total Assessment is a certain percentage of the fair market value that is determined by local assessors to be the total taxable value of land and additions on the property. | Land | Improvement |
|---|---|---|---|---|
| 2025 | $9,181 | $277,200 | $77,500 | $199,700 |
| 2024 | $8,410 | $277,200 | $77,500 | $199,700 |
| 2023 | $8,410 | $277,200 | $77,500 | $199,700 |
| 2022 | $8,155 | $277,200 | $77,500 | $199,700 |
| 2021 | $8,299 | $277,200 | $77,500 | $199,700 |
| 2020 | $8,407 | $277,200 | $77,500 | $199,700 |
| 2019 | $8,091 | $275,000 | $77,500 | $197,500 |
| 2018 | $7,942 | $275,000 | $77,500 | $197,500 |
| 2017 | $7,893 | $275,000 | $77,500 | $197,500 |
| 2016 | $7,648 | $275,000 | $77,500 | $197,500 |
| 2015 | $7,582 | $275,000 | $77,500 | $197,500 |
| 2014 | $7,920 | $299,100 | $77,500 | $221,600 |
Source: Public Records
Map
Nearby Homes
- 10 Cutts Dr
- 49 Magnolia Ln
- 18 Forest Ln
- 6 Horseshoe Ct
- 43 Woodside Dr
- 45 Lakeview Dr
- 52 Summit Dr
- 326 Pricketts Mill Rd
- 1533 Route 206
- 73 Flyatt Rd
- 5 Liberty Cir
- 26 Tuckerton Rd
- 26 Glen Lake Dr
- 419 Oakshade Rd
- 32 Constitution Dr
- 579 and 583 Tabernacle Rd
- 114 Headwater Dr
- 1414 Stokes Rd
- 19 Grande Blvd
- 1294 Route 206