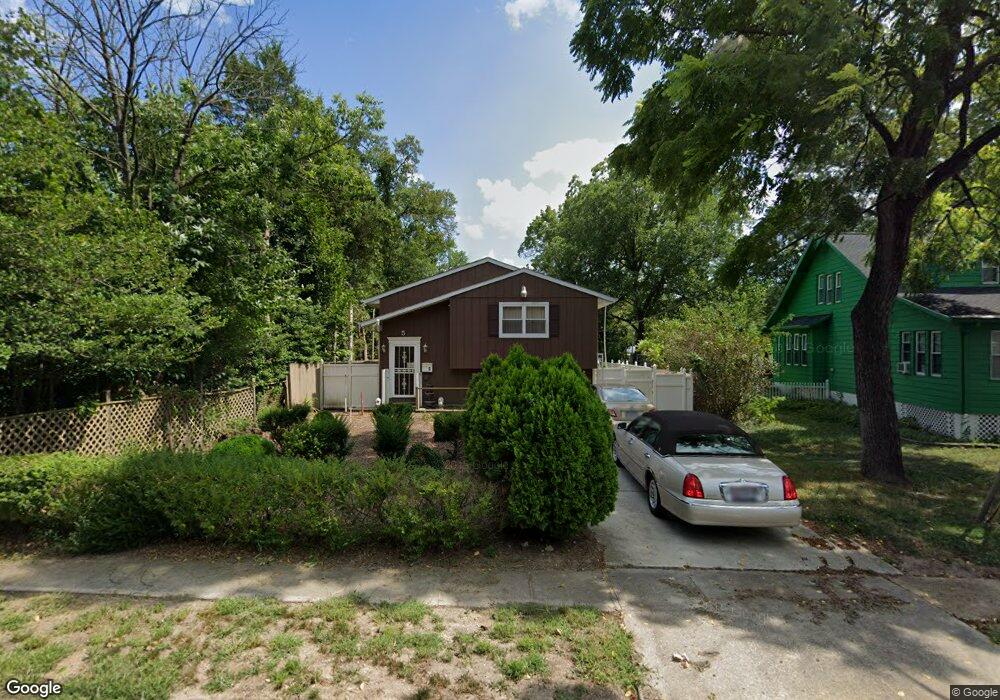
5 Oak Ln SW Glen Burnie, MD 21061
Estimated Value: $373,000 - $399,620
--
Bed
2
Baths
1,102
Sq Ft
$346/Sq Ft
Est. Value
About This Home
This home is located at 5 Oak Ln SW, Glen Burnie, MD 21061 and is currently estimated at $381,155, approximately $345 per square foot. 5 Oak Ln SW is a home located in Anne Arundel County with nearby schools including Richard Henry Lee Elementary School, Corkran Middle School, and Glen Burnie High School.
Ownership History
Date
Name
Owned For
Owner Type
Purchase Details
Closed on
Feb 4, 2025
Sold by
Morris Troy Eugene and Morris Michele Marchetti
Bought by
Keller Rebecca A and Cameron Jordan
Current Estimated Value
Home Financials for this Owner
Home Financials are based on the most recent Mortgage that was taken out on this home.
Original Mortgage
$358,388
Outstanding Balance
$356,233
Interest Rate
6.85%
Mortgage Type
FHA
Estimated Equity
$24,922
Purchase Details
Closed on
May 2, 2024
Sold by
Morris Michele Marchetti
Bought by
Marchetti Morris Michele and Marchetti Eugene Morris
Purchase Details
Closed on
Nov 15, 2001
Sold by
Marchetti Daniel D and Marchetti Patricia A
Bought by
Marchetti Daniel D
Purchase Details
Closed on
Aug 16, 1979
Bought by
Marchetti Daniel C and Marchetti Patricia A
Home Financials for this Owner
Home Financials are based on the most recent Mortgage that was taken out on this home.
Original Mortgage
$26,700
Interest Rate
11.08%
Create a Home Valuation Report for This Property
The Home Valuation Report is an in-depth analysis detailing your home's value as well as a comparison with similar homes in the area
Home Values in the Area
Average Home Value in this Area
Purchase History
| Date | Buyer | Sale Price | Title Company |
|---|---|---|---|
| Keller Rebecca A | $365,000 | Admiral Title | |
| Keller Rebecca A | $365,000 | Admiral Title | |
| Marchetti Morris Michele | -- | None Listed On Document | |
| Marchetti Morris Michele | -- | None Listed On Document | |
| Morris Michele Marchetti | -- | None Listed On Document | |
| Marchetti Daniel D | -- | None Available | |
| Marchetti Daniel C | $55,900 | -- |
Source: Public Records
Mortgage History
| Date | Status | Borrower | Loan Amount |
|---|---|---|---|
| Open | Keller Rebecca A | $358,388 | |
| Closed | Keller Rebecca A | $358,388 | |
| Previous Owner | Marchetti Daniel C | $26,700 |
Source: Public Records
Tax History Compared to Growth
Tax History
| Year | Tax Paid | Tax Assessment Tax Assessment Total Assessment is a certain percentage of the fair market value that is determined by local assessors to be the total taxable value of land and additions on the property. | Land | Improvement |
|---|---|---|---|---|
| 2025 | $3,770 | $319,000 | $150,900 | $168,100 |
| 2024 | $3,770 | $298,433 | $0 | $0 |
| 2023 | $2,226 | $277,867 | $0 | $0 |
| 2022 | $2,506 | $257,300 | $130,900 | $126,400 |
| 2021 | $2,385 | $253,000 | $0 | $0 |
| 2020 | $2,385 | $248,700 | $0 | $0 |
| 2019 | $2,349 | $244,400 | $115,900 | $128,500 |
| 2018 | $2,249 | $240,967 | $0 | $0 |
| 2017 | $2,223 | $237,533 | $0 | $0 |
| 2016 | -- | $234,100 | $0 | $0 |
| 2015 | -- | $226,600 | $0 | $0 |
| 2014 | -- | $219,100 | $0 | $0 |
Source: Public Records
Map
Nearby Homes
- 105 Chestnut Ln
- 303 A St SW
- 105 New Jersey Ave NW
- 108 New Jersey Ave NW
- 305 Newfield Rd
- 106 3rd Ave SE
- 611 Glenview Ave
- 103 4th Ave SE
- 420 Lincoln Ave SW
- 209 Lincoln Ave SW
- 308 Maryland Ave NE
- 102 Kent Rd
- 507 Wills Ln
- 7530 Baltimore Annapolis Blvd
- 112 Main Ave SE
- 530 Delmar Ave
- 538 Elizabeth Ln
- 504 Kent Cir
- 106 Heather Stone Way Unit 43
- 118 Heather Stone Way Unit 80