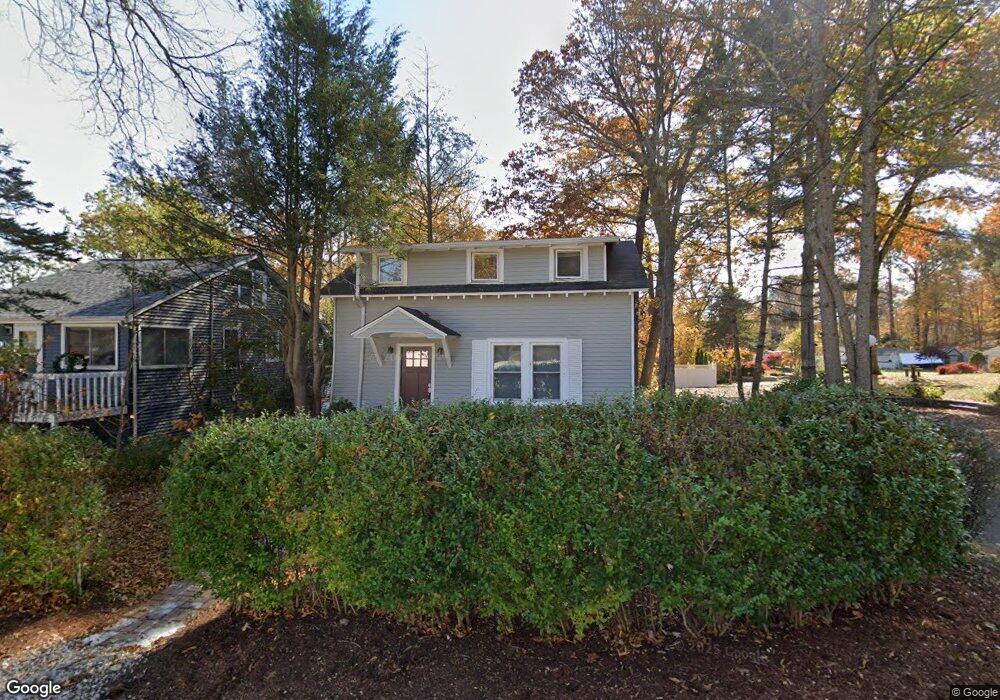
5 Ola Ave East Hampton, CT 06424
Estimated Value: $219,000 - $332,000
2
Beds
1
Bath
1,040
Sq Ft
$262/Sq Ft
Est. Value
About This Home
This home is located at 5 Ola Ave, East Hampton, CT 06424 and is currently estimated at $272,611, approximately $262 per square foot. 5 Ola Ave is a home located in Middlesex County with nearby schools including Memorial School, Center Elementary School, and East Hampton Middle School.
Ownership History
Date
Name
Owned For
Owner Type
Purchase Details
Closed on
Nov 25, 2002
Sold by
Carroll John J
Bought by
Mitchell Mark and Mitchell Janet
Current Estimated Value
Home Financials for this Owner
Home Financials are based on the most recent Mortgage that was taken out on this home.
Original Mortgage
$133,000
Outstanding Balance
$50,981
Interest Rate
4.87%
Estimated Equity
$221,630
Purchase Details
Closed on
Jan 10, 1997
Sold by
White James H and White Carrie M
Bought by
Carroll John J
Create a Home Valuation Report for This Property
The Home Valuation Report is an in-depth analysis detailing your home's value as well as a comparison with similar homes in the area
Home Values in the Area
Average Home Value in this Area
Purchase History
| Date | Buyer | Sale Price | Title Company |
|---|---|---|---|
| Mitchell Mark | $140,000 | -- | |
| Mitchell Mark | $140,000 | -- | |
| Carroll John J | $99,000 | -- | |
| Carroll John J | $99,000 | -- |
Source: Public Records
Mortgage History
| Date | Status | Borrower | Loan Amount |
|---|---|---|---|
| Open | Carroll John J | $133,000 | |
| Closed | Carroll John J | $133,000 | |
| Previous Owner | Carroll John J | $100,000 |
Source: Public Records
Tax History Compared to Growth
Tax History
| Year | Tax Paid | Tax Assessment Tax Assessment Total Assessment is a certain percentage of the fair market value that is determined by local assessors to be the total taxable value of land and additions on the property. | Land | Improvement |
|---|---|---|---|---|
| 2025 | $4,342 | $109,350 | $49,910 | $59,440 |
| 2024 | $4,160 | $109,350 | $49,910 | $59,440 |
| 2023 | $3,943 | $109,350 | $49,910 | $59,440 |
| 2022 | $3,790 | $109,350 | $49,910 | $59,440 |
| 2021 | $3,776 | $109,350 | $49,910 | $59,440 |
| 2020 | $3,158 | $95,290 | $34,380 | $60,910 |
| 2019 | $3,378 | $101,920 | $38,820 | $63,100 |
| 2018 | $3,192 | $101,920 | $38,820 | $63,100 |
| 2017 | $3,192 | $101,920 | $38,820 | $63,100 |
| 2016 | $3,001 | $101,920 | $38,820 | $63,100 |
| 2015 | $3,122 | $112,390 | $45,680 | $66,710 |
| 2014 | $2,716 | $112,390 | $45,680 | $66,710 |
Source: Public Records
Map
Nearby Homes