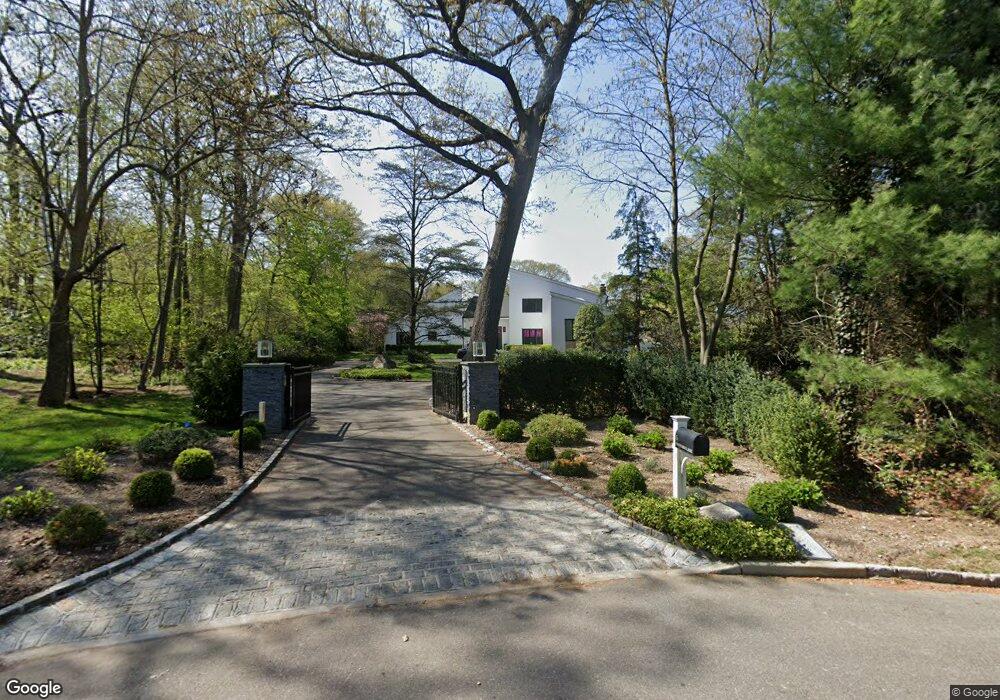
5 Old Farm Ln Old Westbury, NY 11568
Old Westbury NeighborhoodEstimated Value: $3,147,978 - $3,257,000
5
Beds
4
Baths
6,000
Sq Ft
$534/Sq Ft
Est. Value
About This Home
This home is located at 5 Old Farm Ln, Old Westbury, NY 11568 and is currently estimated at $3,202,489, approximately $533 per square foot. 5 Old Farm Ln is a home located in Nassau County with nearby schools including Roslyn Middle School, Roslyn High School, and Holy Child Academy.
Ownership History
Date
Name
Owned For
Owner Type
Purchase Details
Closed on
Nov 7, 2017
Sold by
Spar Abbe
Bought by
Stier Travis and Stier Allison
Current Estimated Value
Home Financials for this Owner
Home Financials are based on the most recent Mortgage that was taken out on this home.
Original Mortgage
$1,720,000
Outstanding Balance
$1,443,557
Interest Rate
3.91%
Mortgage Type
New Conventional
Estimated Equity
$1,758,932
Purchase Details
Closed on
Nov 7, 1998
Purchase Details
Closed on
Apr 14, 1998
Sold by
Leiter Walter I Marilyn J
Bought by
Spar Eric and Spar Abbe
Create a Home Valuation Report for This Property
The Home Valuation Report is an in-depth analysis detailing your home's value as well as a comparison with similar homes in the area
Home Values in the Area
Average Home Value in this Area
Purchase History
| Date | Buyer | Sale Price | Title Company |
|---|---|---|---|
| Stier Travis | $2,150,000 | Old Republic Nationaltitle | |
| -- | -- | -- | |
| Spar Eric | $1,200,000 | -- |
Source: Public Records
Mortgage History
| Date | Status | Borrower | Loan Amount |
|---|---|---|---|
| Open | Stier Travis | $1,720,000 |
Source: Public Records
Tax History Compared to Growth
Tax History
| Year | Tax Paid | Tax Assessment Tax Assessment Total Assessment is a certain percentage of the fair market value that is determined by local assessors to be the total taxable value of land and additions on the property. | Land | Improvement |
|---|---|---|---|---|
| 2025 | $39,309 | $2,004 | $958 | $1,046 |
| 2024 | $3,370 | $1,938 | $926 | $1,012 |
| 2023 | $37,055 | $2,167 | $1,036 | $1,131 |
| 2022 | $37,055 | $2,233 | $1,067 | $1,166 |
| 2021 | $34,906 | $2,190 | $987 | $1,203 |
| 2020 | $33,748 | $2,895 | $2,333 | $562 |
| 2019 | $33,614 | $2,895 | $2,187 | $708 |
| 2018 | $33,614 | $3,088 | $0 | $0 |
| 2017 | $30,546 | $3,281 | $2,087 | $1,194 |
| 2016 | $34,733 | $3,474 | $1,658 | $1,816 |
| 2015 | $4,654 | $3,667 | $1,750 | $1,917 |
| 2014 | $4,654 | $3,667 | $1,750 | $1,917 |
| 2013 | $5,906 | $4,889 | $2,333 | $2,556 |
Source: Public Records
Map
Nearby Homes