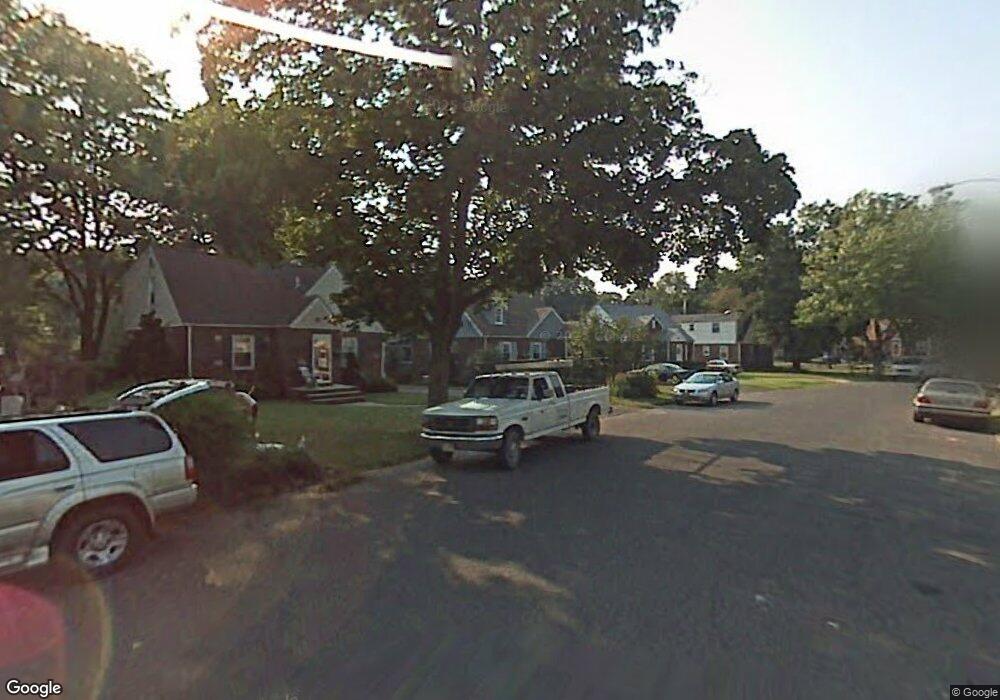
5 Oraton Dr Cranford, NJ 07016
Estimated Value: $654,106 - $860,000
--
Bed
--
Bath
1,521
Sq Ft
$496/Sq Ft
Est. Value
About This Home
This home is located at 5 Oraton Dr, Cranford, NJ 07016 and is currently estimated at $754,527, approximately $496 per square foot. 5 Oraton Dr is a home located in Union County with nearby schools including Cranford Sr High School, St John The Apostle School, and Mother Seton Regional High School.
Ownership History
Date
Name
Owned For
Owner Type
Purchase Details
Closed on
Jan 16, 2001
Sold by
Wagner Lois M
Bought by
Odell Ryan and Odell Heather
Current Estimated Value
Home Financials for this Owner
Home Financials are based on the most recent Mortgage that was taken out on this home.
Original Mortgage
$27,900
Interest Rate
7.52%
Mortgage Type
Stand Alone Second
Purchase Details
Closed on
Apr 5, 1996
Sold by
Arbitblit Eric M and Wagner Lois M
Bought by
Wagner Lois M
Create a Home Valuation Report for This Property
The Home Valuation Report is an in-depth analysis detailing your home's value as well as a comparison with similar homes in the area
Home Values in the Area
Average Home Value in this Area
Purchase History
| Date | Buyer | Sale Price | Title Company |
|---|---|---|---|
| Odell Ryan | $240,000 | -- | |
| Wagner Lois M | $72,750 | Noble Title Agency Inc |
Source: Public Records
Mortgage History
| Date | Status | Borrower | Loan Amount |
|---|---|---|---|
| Closed | Odell Ryan | $27,900 | |
| Open | Odell Ryan | $192,000 |
Source: Public Records
Tax History Compared to Growth
Tax History
| Year | Tax Paid | Tax Assessment Tax Assessment Total Assessment is a certain percentage of the fair market value that is determined by local assessors to be the total taxable value of land and additions on the property. | Land | Improvement |
|---|---|---|---|---|
| 2025 | $11,287 | $166,500 | $76,500 | $90,000 |
| 2024 | $11,101 | $166,500 | $76,500 | $90,000 |
| 2023 | $11,101 | $166,500 | $76,500 | $90,000 |
| 2022 | $11,009 | $166,500 | $76,500 | $90,000 |
| 2021 | $10,961 | $166,500 | $76,500 | $90,000 |
| 2020 | $10,926 | $166,500 | $76,500 | $90,000 |
| 2019 | $10,856 | $166,500 | $76,500 | $90,000 |
| 2018 | $10,659 | $166,500 | $76,500 | $90,000 |
| 2017 | $10,293 | $166,500 | $76,500 | $90,000 |
| 2016 | $9,918 | $166,500 | $76,500 | $90,000 |
| 2015 | $9,659 | $166,500 | $76,500 | $90,000 |
| 2014 | $9,461 | $166,500 | $76,500 | $90,000 |
Source: Public Records
Map
Nearby Homes