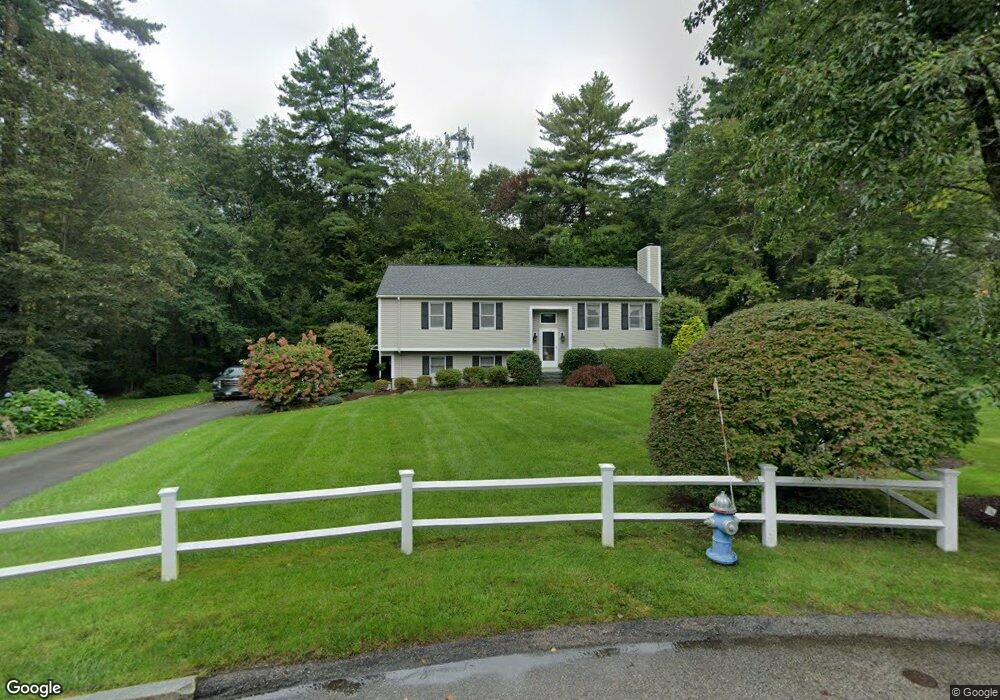
5 Orchard St Medway, MA 02053
Estimated Value: $654,291 - $775,000
3
Beds
3
Baths
1,276
Sq Ft
$566/Sq Ft
Est. Value
About This Home
This home is located at 5 Orchard St, Medway, MA 02053 and is currently estimated at $722,323, approximately $566 per square foot. 5 Orchard St is a home located in Norfolk County with nearby schools including John D. McGovern Elementary School, Burke-Memorial Elementary, and Medway Middle School.
Ownership History
Date
Name
Owned For
Owner Type
Purchase Details
Closed on
May 25, 2001
Sold by
Comiskey Catherine A
Bought by
Stgeorge Kerry J
Current Estimated Value
Home Financials for this Owner
Home Financials are based on the most recent Mortgage that was taken out on this home.
Original Mortgage
$250,000
Interest Rate
7.05%
Mortgage Type
Purchase Money Mortgage
Purchase Details
Closed on
May 21, 1992
Sold by
Malloy Tr Joseph D and Malloy Michael
Bought by
Comiskey Catherine A
Create a Home Valuation Report for This Property
The Home Valuation Report is an in-depth analysis detailing your home's value as well as a comparison with similar homes in the area
Home Values in the Area
Average Home Value in this Area
Purchase History
| Date | Buyer | Sale Price | Title Company |
|---|---|---|---|
| Stgeorge Kerry J | $312,900 | -- | |
| Comiskey Catherine A | $62,500 | -- |
Source: Public Records
Mortgage History
| Date | Status | Borrower | Loan Amount |
|---|---|---|---|
| Open | Comiskey Catherine A | $233,900 | |
| Closed | Comiskey Catherine A | $250,000 | |
| Previous Owner | Comiskey Catherine A | $140,000 |
Source: Public Records
Tax History Compared to Growth
Tax History
| Year | Tax Paid | Tax Assessment Tax Assessment Total Assessment is a certain percentage of the fair market value that is determined by local assessors to be the total taxable value of land and additions on the property. | Land | Improvement |
|---|---|---|---|---|
| 2025 | $7,917 | $555,600 | $290,200 | $265,400 |
| 2024 | $8,001 | $555,600 | $290,200 | $265,400 |
| 2023 | $7,901 | $495,700 | $240,500 | $255,200 |
| 2022 | $7,410 | $437,700 | $213,500 | $224,200 |
| 2021 | $7,427 | $425,400 | $196,900 | $228,500 |
| 2020 | $7,117 | $406,700 | $182,400 | $224,300 |
| 2019 | $6,757 | $398,200 | $182,400 | $215,800 |
| 2018 | $6,810 | $385,600 | $174,100 | $211,500 |
| 2017 | $6,482 | $361,700 | $167,900 | $193,800 |
| 2016 | $6,438 | $355,500 | $161,700 | $193,800 |
| 2015 | $6,295 | $345,100 | $149,300 | $195,800 |
| 2014 | $6,223 | $330,300 | $149,300 | $181,000 |
Source: Public Records
Map
Nearby Homes
- 22 Sunset Dr
- 14 Heritage Dr
- 3 Meryl St
- 12 Lovering St
- 280 Village St Unit D2
- 36 Lovering St
- 106 Holliston St
- 4 Shaw St
- 50 Main St
- 176 Main St Unit 3
- 28 Wellington St
- 20 Broad St Unit 6
- 20 Broad St Unit A
- 20 Broad St Unit 4
- 14 Sanford St Unit 15
- 9 Sanford St
- 220 Main St Unit 220
- 5 Fales St
- 21 Riverside Rd
- 6 Freedom Trail
- 4 Orchard St
- 3 Orchard St
- 2 Orchard St
- 1 Orchard St
- 20 Malloy St
- 17 Malloy St
- 113 Main St Unit Rear
- 18 Henry St
- 107 Main St
- 89 Main St Unit 101
- 89 Main St Unit D
- 89 Main St Unit 214
- 89 Main St Unit 111
- 89 Main St Unit 109
- 89 Main St Unit 205
- 89 Main St Unit B
- 89 Main St Unit 107
- 89 Main St Unit 204
- 89 Main St Unit 302
- 89 Main St Unit 215