Estimated Value: $1,152,000 - $1,343,000
3
Beds
3
Baths
2,514
Sq Ft
$486/Sq Ft
Est. Value
About This Home
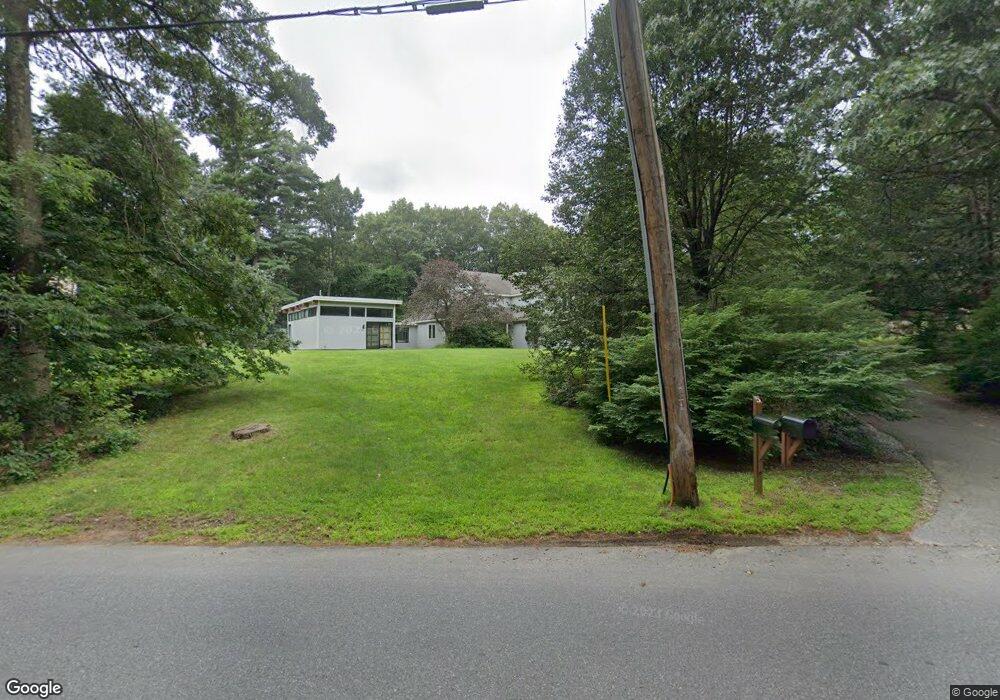
This home is located at 5 Parker St Unit n/a, Acton, MA 01720 and is currently estimated at $1,220,706, approximately $485 per square foot. 5 Parker St Unit n/a is a home located in Middlesex County with nearby schools including Acton-Boxborough Regional High School, Maynard Knowledge Beginnings, and The Imago School.
Ownership History
Date
Name
Owned For
Owner Type
Purchase Details
Closed on
Apr 26, 2024
Sold by
Mihail & Ala Jojatu Ft and Jojatu
Bought by
Datta Sanjeev and Datta Sunila P
Current Estimated Value
Purchase Details
Closed on
Jun 30, 1992
Sold by
Walsh David E and Walsh Randy L
Bought by
Datta Sanjeev and Datta Sunila P
Home Financials for this Owner
Home Financials are based on the most recent Mortgage that was taken out on this home.
Original Mortgage
$202,300
Interest Rate
8.57%
Mortgage Type
Purchase Money Mortgage
Purchase Details
Closed on
May 21, 1991
Sold by
Middlesex Sb
Bought by
Walsh David E and Walsh Randy L
Purchase Details
Closed on
Apr 26, 1991
Sold by
Renaissance Constr Co
Bought by
Middlesex Svgs Bk
Create a Home Valuation Report for This Property
The Home Valuation Report is an in-depth analysis detailing your home's value as well as a comparison with similar homes in the area
Home Values in the Area
Average Home Value in this Area
Purchase History
| Date | Buyer | Sale Price | Title Company |
|---|---|---|---|
| Datta Sanjeev | -- | None Available | |
| Datta Sanjeev | -- | None Available | |
| Datta Sanjeev | $257,000 | -- | |
| Datta Sanjeev | $257,000 | -- | |
| Walsh David E | $249,500 | -- | |
| Walsh David E | $249,500 | -- | |
| Middlesex Svgs Bk | $257,000 | -- | |
| Middlesex Svgs Bk | $257,000 | -- |
Source: Public Records
Mortgage History
| Date | Status | Borrower | Loan Amount |
|---|---|---|---|
| Previous Owner | Middlesex Svgs Bk | $186,200 | |
| Previous Owner | Middlesex Svgs Bk | $200,700 | |
| Previous Owner | Middlesex Svgs Bk | $202,300 |
Source: Public Records
Tax History Compared to Growth
Tax History
| Year | Tax Paid | Tax Assessment Tax Assessment Total Assessment is a certain percentage of the fair market value that is determined by local assessors to be the total taxable value of land and additions on the property. | Land | Improvement |
|---|---|---|---|---|
| 2025 | $17,510 | $1,021,000 | $285,800 | $735,200 |
| 2024 | $16,707 | $1,002,200 | $285,800 | $716,400 |
| 2023 | $16,352 | $931,200 | $260,200 | $671,000 |
| 2022 | $15,391 | $791,300 | $226,200 | $565,100 |
| 2021 | $15,057 | $744,300 | $209,400 | $534,900 |
| 2020 | $14,574 | $757,500 | $209,400 | $548,100 |
| 2019 | $14,014 | $723,500 | $209,400 | $514,100 |
| 2018 | $11,890 | $613,500 | $209,400 | $404,100 |
| 2017 | $11,569 | $607,000 | $209,400 | $397,600 |
| 2016 | $11,659 | $606,300 | $209,400 | $396,900 |
| 2015 | $10,521 | $552,300 | $209,400 | $342,900 |
| 2014 | $10,264 | $527,700 | $209,400 | $318,300 |
Source: Public Records
Map
Nearby Homes
- 303 School St
- 118 Parker St Unit 16
- 128 Parker St Unit 3B
- 132 Parker St Unit G5
- 70 River St
- 65 Summit St
- 128 Audubon Dr
- 70 Hillside Ave
- 12 Brewster Ln
- 10 Wright Rd
- 88 Wright Rd
- 40 High St
- 46 Taylor Rd
- 37 Water St
- 27 Water St
- 1828 Main St
- 1844 Main St Unit 1844
- 80 N Branch Rd
- 1687 Main St
- 129 Main St Unit 129