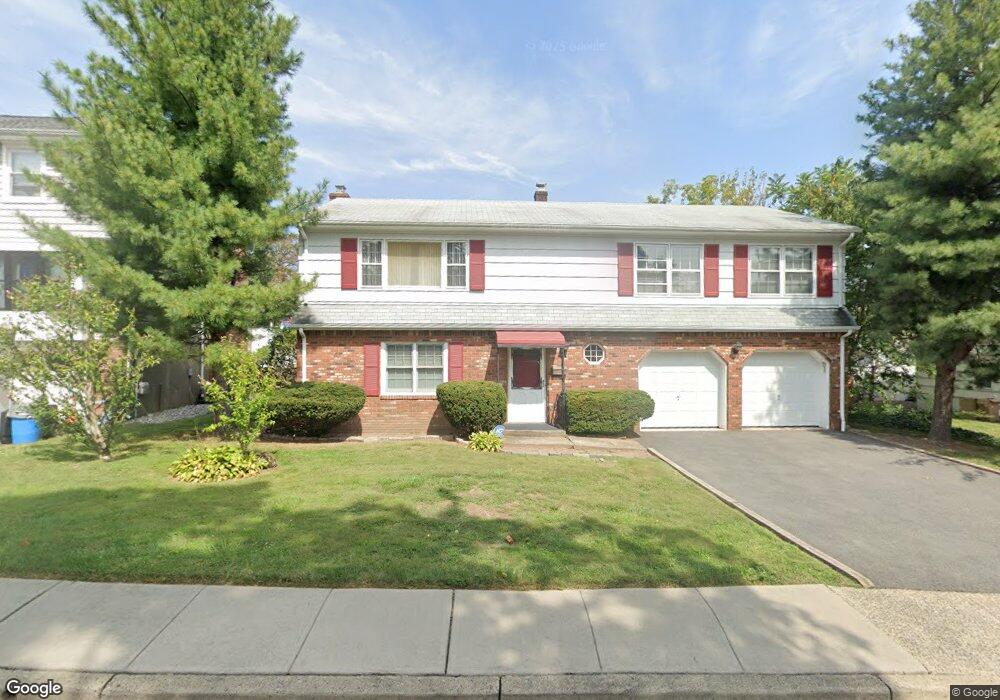
5 Parsons Ct Bloomfield, NJ 07003
Estimated Value: $667,370 - $833,000
Studio
--
Bath
2,016
Sq Ft
$387/Sq Ft
Est. Value
About This Home
This home is located at 5 Parsons Ct, Bloomfield, NJ 07003 and is currently estimated at $781,093, approximately $387 per square foot. 5 Parsons Ct is a home located in Essex County with nearby schools including Brookdale School, Bloomfield Middle School, and Bloomfield High School.
Ownership History
Date
Name
Owned For
Owner Type
Purchase Details
Closed on
Aug 15, 2000
Sold by
Robinson Juliet M
Bought by
Beuve Annie
Current Estimated Value
Home Financials for this Owner
Home Financials are based on the most recent Mortgage that was taken out on this home.
Original Mortgage
$176,000
Outstanding Balance
$63,095
Interest Rate
8.06%
Estimated Equity
$717,998
Purchase Details
Closed on
Jun 14, 2000
Sold by
Zichello Nicholas
Bought by
Robinson Juliet M
Home Financials for this Owner
Home Financials are based on the most recent Mortgage that was taken out on this home.
Original Mortgage
$126,000
Interest Rate
8.48%
Create a Home Valuation Report for This Property
The Home Valuation Report is an in-depth analysis detailing your home's value as well as a comparison with similar homes in the area
Home Values in the Area
Average Home Value in this Area
Purchase History
| Date | Buyer | Sale Price | Title Company |
|---|---|---|---|
| Beuve Annie | $256,000 | -- | |
| Robinson Juliet M | $229,000 | -- |
Source: Public Records
Mortgage History
| Date | Status | Borrower | Loan Amount |
|---|---|---|---|
| Open | Beuve Annie | $176,000 | |
| Previous Owner | Robinson Juliet M | $126,000 |
Source: Public Records
Tax History
| Year | Tax Paid | Tax Assessment Tax Assessment Total Assessment is a certain percentage of the fair market value that is determined by local assessors to be the total taxable value of land and additions on the property. | Land | Improvement |
|---|---|---|---|---|
| 2025 | $13,690 | $418,900 | $173,800 | $245,100 |
| 2024 | $13,690 | $418,900 | $173,800 | $245,100 |
| 2022 | $13,413 | $418,900 | $173,800 | $245,100 |
| 2021 | $13,166 | $418,900 | $173,800 | $245,100 |
| 2020 | $12,965 | $418,900 | $173,800 | $245,100 |
| 2019 | $14,085 | $353,800 | $172,000 | $181,800 |
| 2018 | $14,025 | $353,800 | $172,000 | $181,800 |
| 2017 | $13,812 | $353,800 | $172,000 | $181,800 |
| 2016 | $13,657 | $353,800 | $172,000 | $181,800 |
| 2015 | $13,533 | $353,800 | $172,000 | $181,800 |
| 2014 | $13,285 | $353,800 | $172,000 | $181,800 |
Source: Public Records
Map
Nearby Homes
- 58 Yantecaw Ave
- 14 Davidson Rd
- 9 Glenfield Rd
- 15 Poe Ave
- 68 Bell St
- 26 Clairidge Ct
- 1169 Broad St
- 90 Dewey St
- 17 Glen Ridge Pkwy
- 383-387 Broughton Ave
- 387 Broughton Ave
- 9 Mount Vernon Rd
- 3 Christopher Ct
- 281 Forest Ave
- 381 Essex Ave
- 41 Glenridge Ave Unit 2L
- 371 Essex Ave
- 18 Ketner St
- 33 Daka Ct
- 256 Forest Ave
Your Personal Tour Guide
Ask me questions while you tour the home.