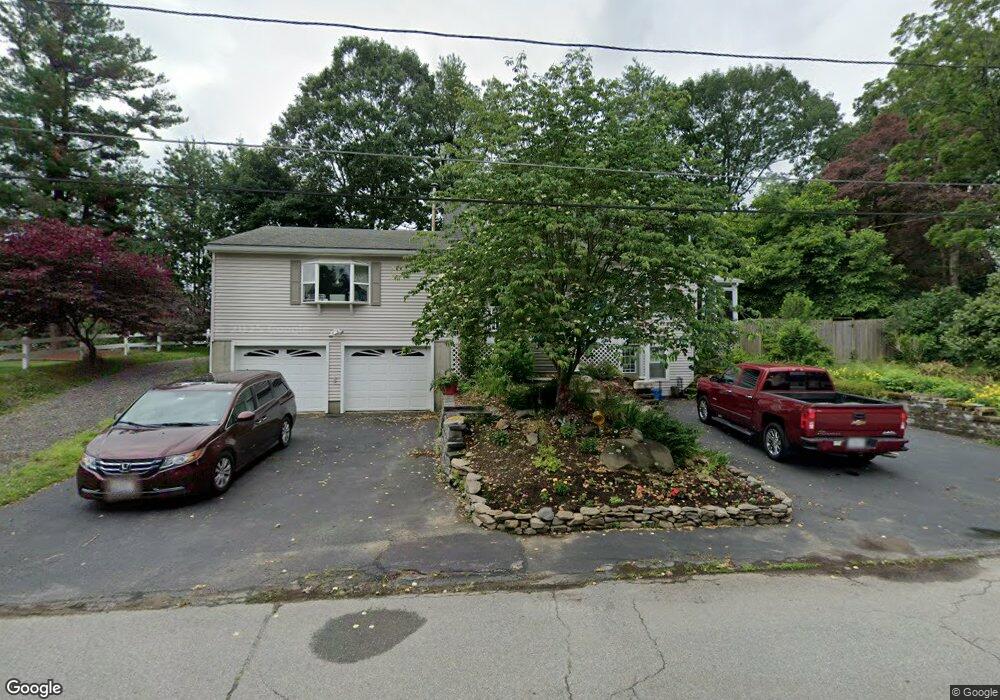
5 Paul St Auburn, MA 01501
Downtown Auburn NeighborhoodEstimated Value: $474,000 - $546,000
3
Beds
2
Baths
1,638
Sq Ft
$315/Sq Ft
Est. Value
About This Home
This home is located at 5 Paul St, Auburn, MA 01501 and is currently estimated at $516,489, approximately $315 per square foot. 5 Paul St is a home located in Worcester County with nearby schools including Auburn Senior High School and Shrewsbury Montessori School - Auburn Campus.
Ownership History
Date
Name
Owned For
Owner Type
Purchase Details
Closed on
Feb 5, 1999
Sold by
Billings Kevin J and Billings Suzanne M
Bought by
Latino Ann and Hodgman Elizabeth
Current Estimated Value
Purchase Details
Closed on
Jun 30, 1995
Sold by
Sturdevant Preston and Sturdevant Marie L
Bought by
Billings Kevin and Billings Suzanne
Create a Home Valuation Report for This Property
The Home Valuation Report is an in-depth analysis detailing your home's value as well as a comparison with similar homes in the area
Home Values in the Area
Average Home Value in this Area
Purchase History
| Date | Buyer | Sale Price | Title Company |
|---|---|---|---|
| Latino Ann | $128,500 | -- | |
| Billings Kevin | $107,000 | -- |
Source: Public Records
Mortgage History
| Date | Status | Borrower | Loan Amount |
|---|---|---|---|
| Open | Billings Kevin | $197,000 | |
| Closed | Billings Kevin | $125,000 |
Source: Public Records
Tax History
| Year | Tax Paid | Tax Assessment Tax Assessment Total Assessment is a certain percentage of the fair market value that is determined by local assessors to be the total taxable value of land and additions on the property. | Land | Improvement |
|---|---|---|---|---|
| 2025 | $64 | $451,000 | $137,500 | $313,500 |
| 2024 | $6,671 | $446,800 | $130,800 | $316,000 |
| 2023 | $6,543 | $412,000 | $118,900 | $293,100 |
| 2022 | $6,069 | $360,800 | $118,900 | $241,900 |
| 2021 | $5,845 | $322,200 | $104,900 | $217,300 |
| 2020 | $5,639 | $313,600 | $104,900 | $208,700 |
| 2019 | $5,517 | $299,500 | $103,900 | $195,600 |
| 2018 | $5,344 | $289,800 | $97,100 | $192,700 |
| 2017 | $5,108 | $278,500 | $88,100 | $190,400 |
| 2016 | $4,850 | $268,100 | $92,400 | $175,700 |
| 2015 | $4,429 | $256,600 | $92,400 | $164,200 |
| 2014 | $4,309 | $249,200 | $88,000 | $161,200 |
Source: Public Records
Map
Nearby Homes
- 8 South Terrace
- 6 George St
- 61 School St
- 751 Washington St Unit 43A
- 166 Leicester St
- 634 Oxford St S
- 35 Waterman Rd
- 328 Oxford St N
- 49 Prospect St
- 31 Walsh Ave
- 31-33 Walsh Ave
- 33 Walsh Ave
- 40 Bryn Mawr Ave
- 6 Buron Terrace
- 808 Washington St
- 0 Athens St
- 19-20 Williams St
- 501 Forest Park Dr Unit 501
- 104 Appleton Rd
- 1-9 Helens Way
Your Personal Tour Guide
Ask me questions while you tour the home.