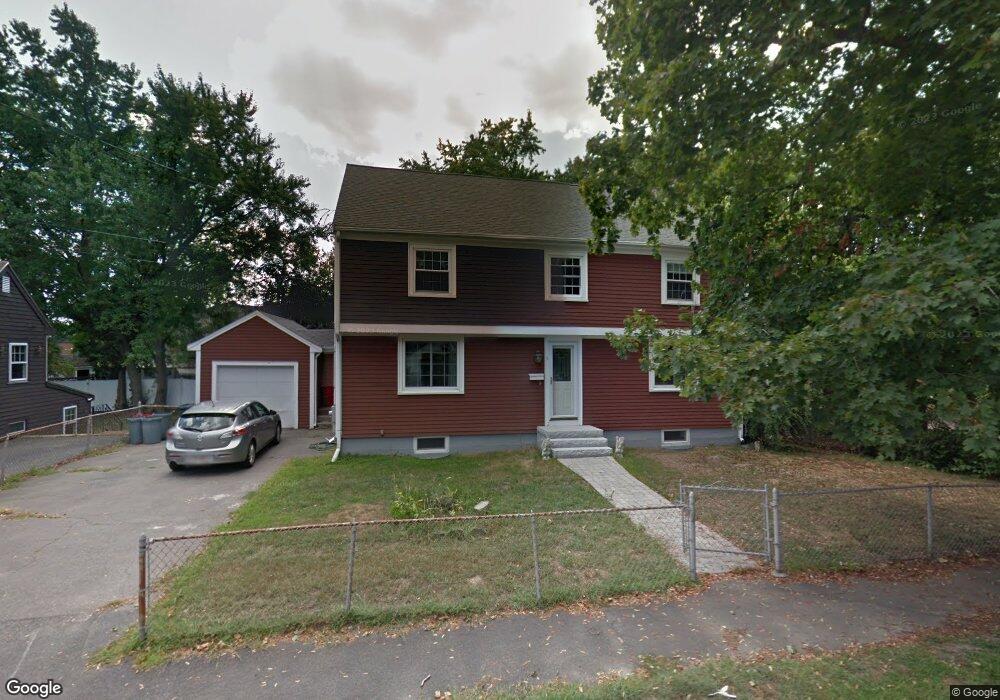
5 Payson St Quincy, MA 02169
South Quincy NeighborhoodEstimated Value: $775,000 - $820,655
3
Beds
2
Baths
1,961
Sq Ft
$409/Sq Ft
Est. Value
About This Home
This home is located at 5 Payson St, Quincy, MA 02169 and is currently estimated at $802,414, approximately $409 per square foot. 5 Payson St is a home located in Norfolk County with nearby schools including Lincoln-Hancock Community School, South West Middle School, and Quincy High School.
Ownership History
Date
Name
Owned For
Owner Type
Purchase Details
Closed on
Jun 6, 2003
Sold by
Brown Albert F and Brown Leonora A
Bought by
Brenner Howard A and Oconnor Erin E
Current Estimated Value
Home Financials for this Owner
Home Financials are based on the most recent Mortgage that was taken out on this home.
Original Mortgage
$304,000
Outstanding Balance
$132,509
Interest Rate
5.83%
Mortgage Type
Purchase Money Mortgage
Estimated Equity
$669,905
Create a Home Valuation Report for This Property
The Home Valuation Report is an in-depth analysis detailing your home's value as well as a comparison with similar homes in the area
Home Values in the Area
Average Home Value in this Area
Purchase History
| Date | Buyer | Sale Price | Title Company |
|---|---|---|---|
| Brenner Howard A | $380,000 | -- |
Source: Public Records
Mortgage History
| Date | Status | Borrower | Loan Amount |
|---|---|---|---|
| Open | Brenner Howard A | $304,000 |
Source: Public Records
Tax History
| Year | Tax Paid | Tax Assessment Tax Assessment Total Assessment is a certain percentage of the fair market value that is determined by local assessors to be the total taxable value of land and additions on the property. | Land | Improvement |
|---|---|---|---|---|
| 2025 | $8,876 | $769,800 | $301,800 | $468,000 |
| 2024 | $8,407 | $746,000 | $287,500 | $458,500 |
| 2023 | $7,651 | $687,400 | $261,300 | $426,100 |
| 2022 | $7,522 | $627,900 | $217,700 | $410,200 |
| 2021 | $7,178 | $591,300 | $217,700 | $373,600 |
| 2020 | $7,136 | $574,100 | $217,700 | $356,400 |
| 2019 | $6,837 | $544,800 | $205,400 | $339,400 |
| 2018 | $6,719 | $503,700 | $190,300 | $313,400 |
| 2017 | $6,585 | $464,700 | $181,200 | $283,500 |
| 2016 | $6,015 | $418,900 | $157,600 | $261,300 |
| 2015 | $5,931 | $406,200 | $157,600 | $248,600 |
| 2014 | $5,694 | $383,200 | $157,600 | $225,600 |
Source: Public Records
Map
Nearby Homes
- 8 Jackson St Unit B1
- 8 Jackson St Unit B4
- 171-175 Granite St
- 87 Franklin St Unit 105
- 56 Penn St Unit 4
- 52 Packards Ln Unit 4
- 91 Garfield St
- 59 Packards Ln Unit 5
- 59 Packards Ln Unit 1
- 59 Packards Ln Unit 3
- 50 N Payne St Unit 6
- 21 Arthur St
- 132 Centre St
- 177 Franklin St
- 81-85 Water St
- 293 Whitwell St
- 21 Totman St Unit 205
- 21 Totman St Unit 409
- 21 Totman St Unit 203
- 21 Totman St Unit 403
Your Personal Tour Guide
Ask me questions while you tour the home.