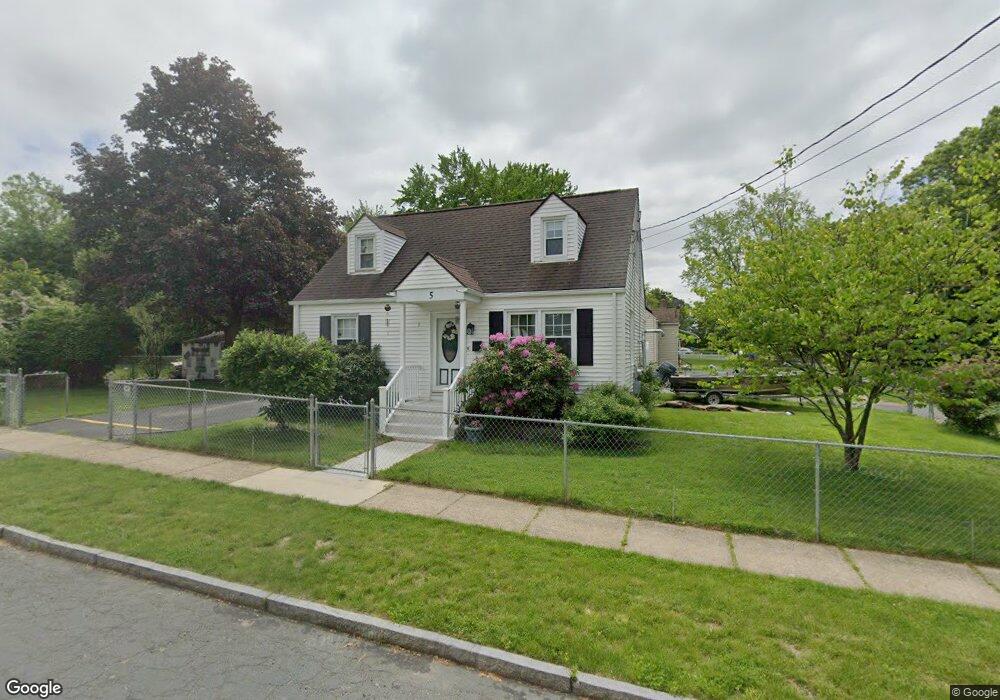
5 Pear St Springfield, MA 01109
Pine Point NeighborhoodEstimated Value: $214,000 - $291,000
3
Beds
1
Bath
1,008
Sq Ft
$256/Sq Ft
Est. Value
About This Home
This home is located at 5 Pear St, Springfield, MA 01109 and is currently estimated at $257,752, approximately $255 per square foot. 5 Pear St is a home located in Hampden County with nearby schools including Frank H. Freedman School, John J Duggan Middle, and Springfield Central High School.
Ownership History
Date
Name
Owned For
Owner Type
Purchase Details
Closed on
Dec 19, 1997
Sold by
Fleming Cynthia A
Bought by
Serrano Luis A and Serrano Alicia
Current Estimated Value
Home Financials for this Owner
Home Financials are based on the most recent Mortgage that was taken out on this home.
Original Mortgage
$53,476
Interest Rate
7.14%
Mortgage Type
Purchase Money Mortgage
Create a Home Valuation Report for This Property
The Home Valuation Report is an in-depth analysis detailing your home's value as well as a comparison with similar homes in the area
Home Values in the Area
Average Home Value in this Area
Purchase History
| Date | Buyer | Sale Price | Title Company |
|---|---|---|---|
| Serrano Luis A | $54,000 | -- |
Source: Public Records
Mortgage History
| Date | Status | Borrower | Loan Amount |
|---|---|---|---|
| Open | Serrano Luis A | $50,733 | |
| Closed | Serrano Luis A | $53,476 |
Source: Public Records
Tax History
| Year | Tax Paid | Tax Assessment Tax Assessment Total Assessment is a certain percentage of the fair market value that is determined by local assessors to be the total taxable value of land and additions on the property. | Land | Improvement |
|---|---|---|---|---|
| 2025 | $3,365 | $214,600 | $39,300 | $175,300 |
| 2024 | $3,031 | $188,700 | $32,800 | $155,900 |
| 2023 | $2,989 | $175,300 | $29,800 | $145,500 |
| 2022 | $3,081 | $163,700 | $27,800 | $135,900 |
| 2021 | $2,663 | $140,900 | $25,300 | $115,600 |
| 2020 | $2,457 | $125,800 | $25,300 | $100,500 |
| 2019 | $2,236 | $113,600 | $25,300 | $88,300 |
| 2018 | $2,118 | $107,600 | $25,300 | $82,300 |
| 2017 | $1,994 | $101,400 | $23,400 | $78,000 |
| 2016 | $1,927 | $98,000 | $23,400 | $74,600 |
| 2015 | $1,884 | $95,800 | $23,400 | $72,400 |
Source: Public Records
Map
Nearby Homes
- 219 Seymour Ave
- 219 Seymour Ave Unit 219
- 6 Pear St
- 223 Seymour Ave
- 15 Pear St
- 242 Pheland St
- 16 Pear St
- 229 Seymour Ave
- 248 Pheland St Unit 1
- 197 Seymour Ave
- 220 Pheland St
- 233 Seymour Ave
- 254 Pheland St
- 189 Seymour Ave
- 239 Seymour Ave
- 214 Pheland St
- 31 Pear St
- 260 Pheland St
- 241 Pheland St
- 32 Pear St
Your Personal Tour Guide
Ask me questions while you tour the home.