32 Pear St Springfield, MA 01109
Pine Point NeighborhoodEstimated Value: $241,000 - $293,000
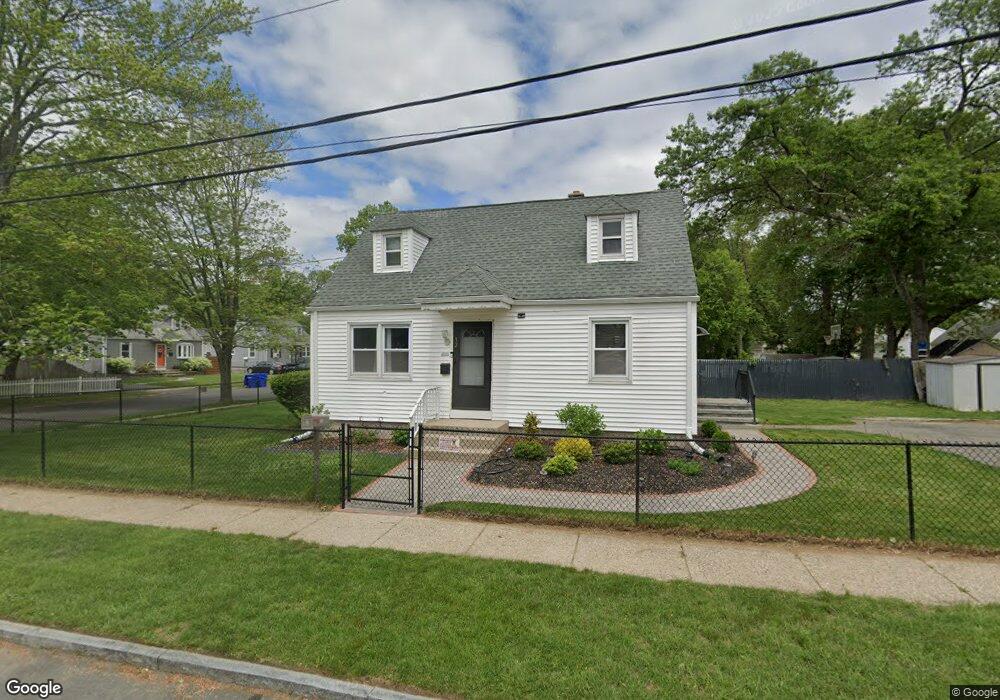
About This Home
This home is located at 32 Pear St, Springfield, MA 01109 and is currently estimated at $272,146, approximately $314 per square foot. 32 Pear St is a home located in Hampden County with nearby schools including Frank H. Freedman School, John J Duggan Middle, and Springfield Central High School.
Ownership History
We collect this data history from publicly available records. To have your information removed, we recommend requesting removal directly through your county’s website.
Purchase Details
Home Financials for this Owner
Home Financials are based on the most recent Mortgage that was taken out on this home.Purchase Details
Purchase Details
Home Financials for this Owner
Home Financials are based on the most recent Mortgage that was taken out on this home.Home Values in the Area
Average Home Value in this Area
Purchase History
We collect this data history from publicly available records. To have your information removed, we recommend requesting removal directly through your county’s website.
| Date | Buyer | Sale Price | Title Company |
|---|---|---|---|
| $160,000 | None Available | ||
| -- | -- | ||
| $80,000 | -- |
Mortgage History
We collect this data history from publicly available records. To have your information removed, we recommend requesting removal directly through your county’s website.
| Date | Status | Borrower | Loan Amount |
|---|---|---|---|
| Open | $152,000 | ||
| Closed | $16,000 | ||
| Previous Owner | $81,900 | ||
| Previous Owner | $37,500 |
Tax History
We collect this data history from publicly available records. To have your information removed, we recommend requesting removal directly through your county’s website.
| Year | Tax Paid | Tax Assessment Tax Assessment Total Assessment is a certain percentage of the fair market value that is determined by local assessors to be the total taxable value of land and additions on the property. | Land | Improvement |
|---|---|---|---|---|
| 2025 | $3,653 | $233,000 | $40,400 | $192,600 |
| 2024 | $3,369 | $209,800 | $33,700 | $176,100 |
| 2023 | $3,277 | $192,200 | $30,600 | $161,600 |
| 2022 | $3,124 | $166,000 | $28,600 | $137,400 |
| 2021 | $2,871 | $151,900 | $26,100 | $125,800 |
| 2020 | $2,805 | $143,600 | $26,100 | $117,500 |
| 2019 | $2,456 | $124,800 | $26,100 | $98,700 |
| 2018 | $2,495 | $126,800 | $26,100 | $100,700 |
| 2017 | $2,170 | $110,400 | $24,100 | $86,300 |
| 2016 | $2,043 | $103,900 | $24,100 | $79,800 |
| 2015 | $1,993 | $101,300 | $24,100 | $77,200 |
Map
- 219 Pheland St
- 42 Pear St
- 31 Pear St
- 246 Breckwood Blvd
- 242 Breckwood Blvd
- 41 Pear St
- 41 Pear St Unit 1
- 16 Pear St
- 213 Pheland St
- 220 Pheland St
- 241 Pheland St
- 236 Breckwood Blvd
- 266 Breckwood Blvd
- 15 Pear St
- 214 Pheland St
- 232 Breckwood Blvd
- 247 Pheland St
- 242 Pheland St
- 272 Breckwood Blvd
- 206 Pheland St
Ask me questions while you tour the home.