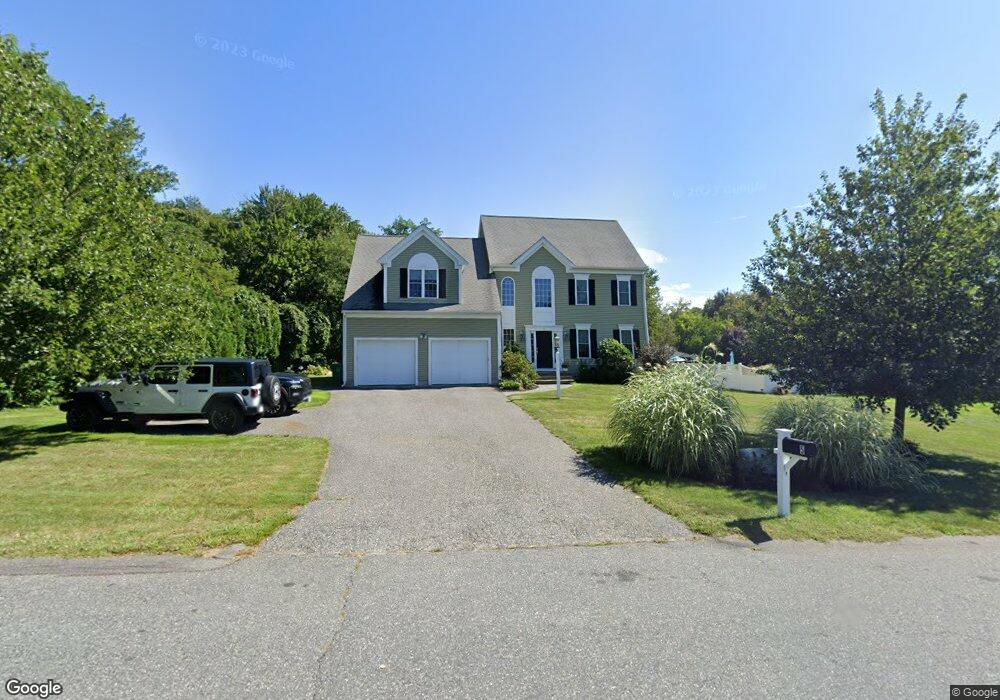
5 Pennock Rd Ashland, MA 01721
Estimated Value: $1,035,939 - $1,170,000
4
Beds
3
Baths
2,565
Sq Ft
$435/Sq Ft
Est. Value
About This Home
This home is located at 5 Pennock Rd, Ashland, MA 01721 and is currently estimated at $1,116,235, approximately $435 per square foot. 5 Pennock Rd is a home located in Middlesex County with nearby schools including William Pittaway Elementary School, David Mindess Elementary School, and Henry E. Warren Elementary School.
Ownership History
Date
Name
Owned For
Owner Type
Purchase Details
Closed on
Jul 2, 2007
Sold by
Magunco Rt and Hickey Steven A
Bought by
Richmond Dev Corp
Current Estimated Value
Home Financials for this Owner
Home Financials are based on the most recent Mortgage that was taken out on this home.
Original Mortgage
$55,000
Outstanding Balance
$33,907
Interest Rate
6.24%
Mortgage Type
Purchase Money Mortgage
Estimated Equity
$1,082,328
Create a Home Valuation Report for This Property
The Home Valuation Report is an in-depth analysis detailing your home's value as well as a comparison with similar homes in the area
Home Values in the Area
Average Home Value in this Area
Purchase History
| Date | Buyer | Sale Price | Title Company |
|---|---|---|---|
| Richmond Dev Corp | $60,000 | -- |
Source: Public Records
Mortgage History
| Date | Status | Borrower | Loan Amount |
|---|---|---|---|
| Open | Richmond Dev Corp | $55,000 |
Source: Public Records
Tax History
| Year | Tax Paid | Tax Assessment Tax Assessment Total Assessment is a certain percentage of the fair market value that is determined by local assessors to be the total taxable value of land and additions on the property. | Land | Improvement |
|---|---|---|---|---|
| 2025 | $12,506 | $979,300 | $314,100 | $665,200 |
| 2024 | $11,872 | $896,700 | $314,100 | $582,600 |
| 2023 | $10,859 | $788,600 | $299,100 | $489,500 |
| 2022 | $10,978 | $691,300 | $271,800 | $419,500 |
| 2021 | $519 | $660,300 | $271,800 | $388,500 |
| 2020 | $10,341 | $639,900 | $271,800 | $368,100 |
| 2019 | $10,142 | $623,000 | $271,800 | $351,200 |
| 2018 | $10,054 | $605,300 | $267,700 | $337,600 |
| 2017 | $9,890 | $592,200 | $266,500 | $325,700 |
| 2016 | $9,682 | $569,500 | $266,500 | $303,000 |
| 2015 | $9,584 | $554,000 | $254,500 | $299,500 |
| 2014 | $9,498 | $546,200 | $236,500 | $309,700 |
Source: Public Records
Map
Nearby Homes
- 30 Pennock Rd
- 9 Olive St
- 20 Braeburn Ln
- 8 Haven Way
- 15 Haven Way
- 22 Wilbur Dr
- 2 Braeburn Ln
- 24 Russet Hill Rd
- 0 Cross St
- 47 Voyagers Ln
- 19 Crispwater Way Unit 178
- 203 Pleasant St
- 10 Metropolitan Ave
- 96 Pleasant St Unit 96
- 2 Grandview Dr
- 6 Waterville Ln Unit 6
- 0 Ballard Highland Marietta Unit 73391306
- 14 Waterville Ln Unit 14
- 257-259 Main St
- 30 Waterville Ln Unit 30
Your Personal Tour Guide
Ask me questions while you tour the home.