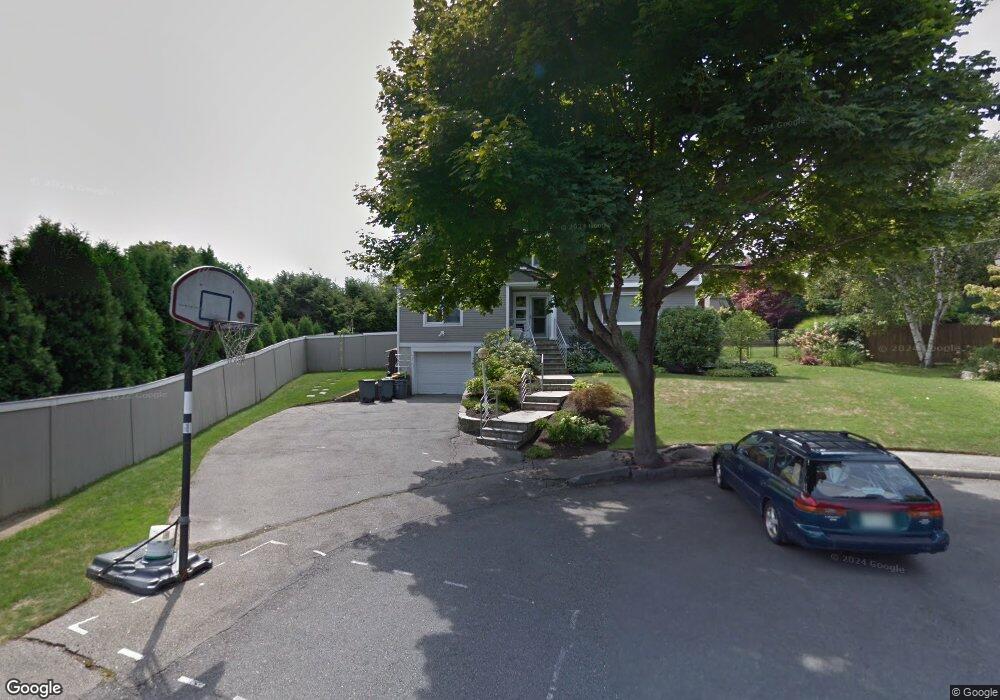
5 Peter Cir Marblehead, MA 01945
Estimated Value: $1,300,643 - $1,512,000
4
Beds
4
Baths
3,479
Sq Ft
$402/Sq Ft
Est. Value
About This Home
This home is located at 5 Peter Cir, Marblehead, MA 01945 and is currently estimated at $1,397,661, approximately $401 per square foot. 5 Peter Cir is a home located in Essex County with nearby schools including Marblehead High School, Devereux School, and Tower School.
Ownership History
Date
Name
Owned For
Owner Type
Purchase Details
Closed on
Dec 21, 2009
Sold by
Epstein Jay M and Simon Stephanie J
Bought by
Simon Stephanie J
Current Estimated Value
Purchase Details
Closed on
Nov 30, 2009
Sold by
Simon Stephanie J
Bought by
Epstein Jay M
Purchase Details
Closed on
Jun 4, 1987
Sold by
Kalp Edward B
Bought by
Rare Coin Galleries
Create a Home Valuation Report for This Property
The Home Valuation Report is an in-depth analysis detailing your home's value as well as a comparison with similar homes in the area
Home Values in the Area
Average Home Value in this Area
Purchase History
| Date | Buyer | Sale Price | Title Company |
|---|---|---|---|
| Simon Stephanie J | -- | -- | |
| Simon Stephanie J | -- | -- | |
| Epstein Jay M | -- | -- | |
| Epstein Jay M | -- | -- | |
| Rare Coin Galleries | $325,000 | -- |
Source: Public Records
Mortgage History
| Date | Status | Borrower | Loan Amount |
|---|---|---|---|
| Open | Rare Coin Galleries | $160,000 | |
| Closed | Rare Coin Galleries | $192,000 |
Source: Public Records
Tax History
| Year | Tax Paid | Tax Assessment Tax Assessment Total Assessment is a certain percentage of the fair market value that is determined by local assessors to be the total taxable value of land and additions on the property. | Land | Improvement |
|---|---|---|---|---|
| 2025 | $10,558 | $1,166,600 | $629,300 | $537,300 |
| 2024 | $10,415 | $1,162,400 | $643,300 | $519,100 |
| 2023 | $9,803 | $980,300 | $566,400 | $413,900 |
| 2022 | $9,555 | $908,300 | $503,500 | $404,800 |
| 2021 | $9,109 | $874,200 | $475,500 | $398,700 |
| 2020 | $9,000 | $866,200 | $475,500 | $390,700 |
| 2019 | $8,685 | $808,700 | $433,500 | $375,200 |
| 2018 | $8,604 | $780,800 | $405,600 | $375,200 |
| 2017 | $8,442 | $766,800 | $391,600 | $375,200 |
| 2016 | $8,201 | $738,800 | $363,600 | $375,200 |
| 2015 | $7,630 | $688,600 | $307,700 | $380,900 |
| 2014 | $7,081 | $638,500 | $279,700 | $358,800 |
Source: Public Records
Map
Nearby Homes
- 4 Dean Rd
- 282 Pleasant St
- 12 Pickwick Rd
- 33 W Shore Dr
- 23 Wyman Rd
- 70 Maverick St
- 212 Humphrey St Unit 205
- 30 Haley Rd Unit 1
- 7 Cottage St
- 11 Angenica Terrace
- 48 Bellevue Rd
- 41 Atlantic Ave Unit 1
- 290 Washington St Unit A
- 6 Mount Vernon St
- 55 Brackett Place Unit B
- 66 Pleasant St Unit 1
- 66 Pleasant St Unit 2
- 55 Roosevelt Ave
- 132 Elm St
- 132 Elm St Unit 132
Your Personal Tour Guide
Ask me questions while you tour the home.