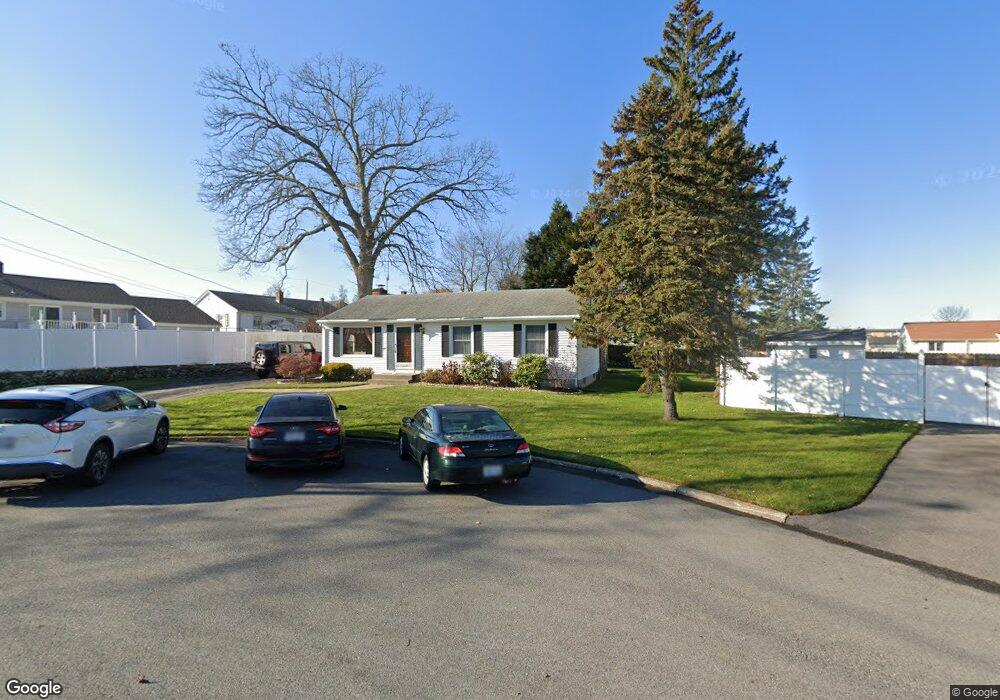
5 Peter Pond Ct East Providence, RI 02914
Outer East Bay NeighborhoodEstimated Value: $438,000 - $457,000
3
Beds
1
Bath
1,436
Sq Ft
$313/Sq Ft
Est. Value
About This Home
This home is located at 5 Peter Pond Ct, East Providence, RI 02914 and is currently estimated at $449,440, approximately $312 per square foot. 5 Peter Pond Ct is a home located in Providence County with nearby schools including East Providence High School, The Gordon School, and Ocean State Montessori School.
Ownership History
Date
Name
Owned For
Owner Type
Purchase Details
Closed on
Jul 14, 1994
Sold by
Lacroix Dennis W and Lacroix Charlene
Bought by
Lemos Cheryl L
Current Estimated Value
Home Financials for this Owner
Home Financials are based on the most recent Mortgage that was taken out on this home.
Original Mortgage
$108,000
Interest Rate
8.51%
Mortgage Type
Purchase Money Mortgage
Create a Home Valuation Report for This Property
The Home Valuation Report is an in-depth analysis detailing your home's value as well as a comparison with similar homes in the area
Home Values in the Area
Average Home Value in this Area
Purchase History
| Date | Buyer | Sale Price | Title Company |
|---|---|---|---|
| Lemos Cheryl L | $135,000 | -- | |
| Lemos Cheryl L | $135,000 | -- |
Source: Public Records
Mortgage History
| Date | Status | Borrower | Loan Amount |
|---|---|---|---|
| Open | Lacroix Dennis W | $150,000 | |
| Closed | Lacroix Dennis W | $97,000 | |
| Closed | Lacroix Dennis W | $108,000 |
Source: Public Records
Tax History Compared to Growth
Tax History
| Year | Tax Paid | Tax Assessment Tax Assessment Total Assessment is a certain percentage of the fair market value that is determined by local assessors to be the total taxable value of land and additions on the property. | Land | Improvement |
|---|---|---|---|---|
| 2024 | $5,267 | $343,600 | $108,000 | $235,600 |
| 2023 | $5,072 | $343,600 | $108,000 | $235,600 |
| 2022 | $4,945 | $226,200 | $58,600 | $167,600 |
| 2021 | $4,863 | $226,200 | $58,600 | $167,600 |
| 2020 | $4,657 | $226,200 | $58,600 | $167,600 |
| 2019 | $4,529 | $226,200 | $58,600 | $167,600 |
| 2018 | $4,276 | $186,900 | $51,500 | $135,400 |
| 2017 | $4,181 | $186,900 | $51,500 | $135,400 |
| 2016 | $4,160 | $186,900 | $51,500 | $135,400 |
| 2015 | $4,094 | $178,400 | $52,900 | $125,500 |
| 2014 | $4,094 | $178,400 | $52,900 | $125,500 |
Source: Public Records
Map
Nearby Homes
- 34 Ridge Dr
- 82 Martin St
- 23 Martin St
- 74 Brookhaven Dr
- 1402 S Broadway
- 62 Valleybrook Dr
- 180 Grassmere Ave
- 1463 S Broadway
- 740 Veterans Memorial Pkwy
- 1123 S Broadway
- 109 Bliss St
- 164 Brightridge Ave
- 25 Fairview Ave
- 10 Kettle Point Ave
- 400 Juniper St Unit C
- 400 Juniper St Unit B
- 400 Juniper St Unit A
- 78 Ingraham St
- 134 Berkeley St
- 25 Ide Ave