Estimated Value: $704,000 - $1,114,000
3
Beds
2
Baths
1,393
Sq Ft
$590/Sq Ft
Est. Value
About This Home
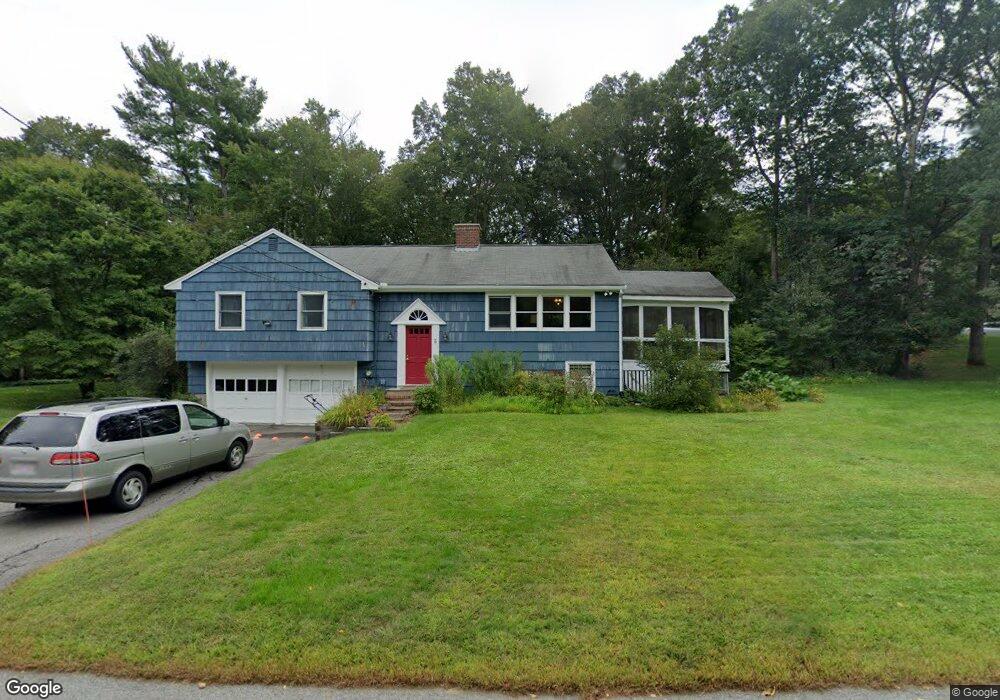
This home is located at 5 Phalen St, Acton, MA 01720 and is currently estimated at $822,546, approximately $590 per square foot. 5 Phalen St is a home located in Middlesex County with nearby schools including Acton-Boxborough Regional High School and Concord Academy.
Ownership History
Date
Name
Owned For
Owner Type
Purchase Details
Closed on
Jan 3, 1996
Sold by
Israelite Lewis L and Israelite Wendy
Bought by
Linker Mark F and Silva Lauren R
Current Estimated Value
Home Financials for this Owner
Home Financials are based on the most recent Mortgage that was taken out on this home.
Original Mortgage
$190,000
Interest Rate
7.34%
Mortgage Type
Purchase Money Mortgage
Create a Home Valuation Report for This Property
The Home Valuation Report is an in-depth analysis detailing your home's value as well as a comparison with similar homes in the area
Home Values in the Area
Average Home Value in this Area
Purchase History
| Date | Buyer | Sale Price | Title Company |
|---|---|---|---|
| Linker Mark F | $237,500 | -- |
Source: Public Records
Mortgage History
| Date | Status | Borrower | Loan Amount |
|---|---|---|---|
| Open | Linker Mark F | $176,000 | |
| Closed | Linker Mark F | $30,000 | |
| Closed | Linker Mark F | $190,000 |
Source: Public Records
Tax History
| Year | Tax Paid | Tax Assessment Tax Assessment Total Assessment is a certain percentage of the fair market value that is determined by local assessors to be the total taxable value of land and additions on the property. | Land | Improvement |
|---|---|---|---|---|
| 2025 | $11,396 | $664,500 | $342,200 | $322,300 |
| 2024 | $10,810 | $648,500 | $342,200 | $306,300 |
| 2023 | $10,592 | $603,200 | $311,200 | $292,000 |
| 2022 | $10,258 | $527,400 | $270,500 | $256,900 |
| 2021 | $9,650 | $477,000 | $250,400 | $226,600 |
| 2020 | $9,177 | $477,000 | $250,400 | $226,600 |
| 2019 | $8,809 | $454,800 | $250,400 | $204,400 |
| 2018 | $8,378 | $432,300 | $250,400 | $181,900 |
| 2017 | $8,087 | $424,300 | $250,400 | $173,900 |
| 2016 | $7,880 | $409,800 | $250,400 | $159,400 |
| 2015 | $7,972 | $418,500 | $250,400 | $168,100 |
| 2014 | $7,798 | $400,900 | $250,400 | $150,500 |
Source: Public Records
Map
Nearby Homes
Your Personal Tour Guide
Ask me questions while you tour the home.