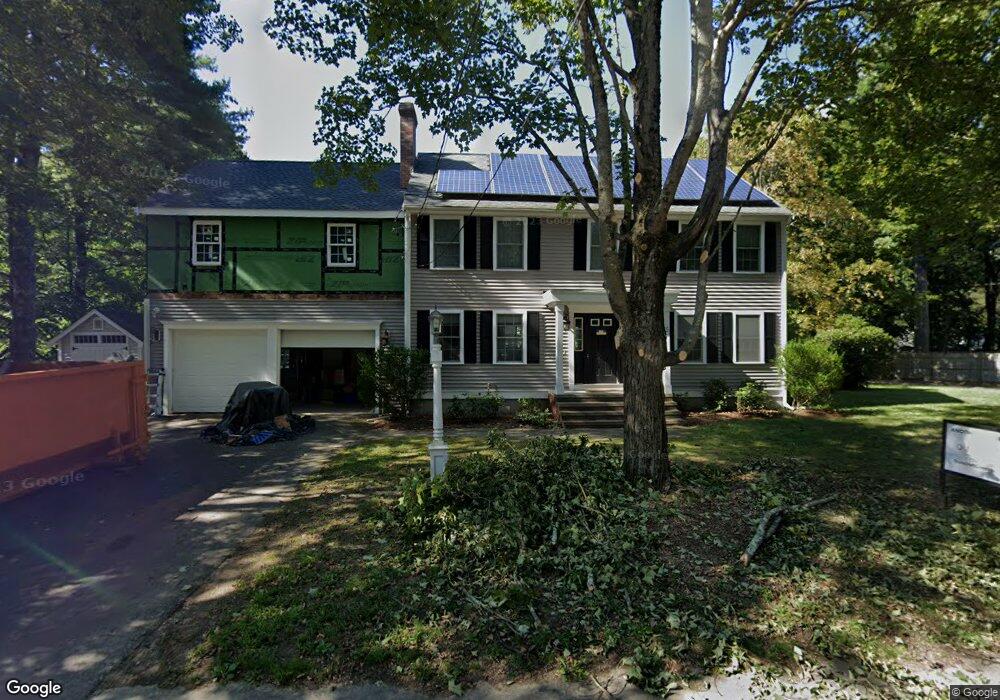
5 Pine Grove Rd Medfield, MA 02052
Estimated Value: $1,196,000 - $1,467,000
4
Beds
3
Baths
2,320
Sq Ft
$559/Sq Ft
Est. Value
About This Home
This home is located at 5 Pine Grove Rd, Medfield, MA 02052 and is currently estimated at $1,296,979, approximately $559 per square foot. 5 Pine Grove Rd is a home located in Norfolk County with nearby schools including Memorial School, Ralph Wheelock School, and Dale Street School.
Ownership History
Date
Name
Owned For
Owner Type
Purchase Details
Closed on
Nov 18, 2009
Sold by
Laplante James A
Bought by
Morrison Kevin M and Morrison Elizabeth
Current Estimated Value
Home Financials for this Owner
Home Financials are based on the most recent Mortgage that was taken out on this home.
Original Mortgage
$496,000
Interest Rate
4.86%
Mortgage Type
Purchase Money Mortgage
Purchase Details
Closed on
Nov 14, 2008
Sold by
Wish Robin V
Bought by
Laplante James A
Home Financials for this Owner
Home Financials are based on the most recent Mortgage that was taken out on this home.
Original Mortgage
$417,000
Interest Rate
6.13%
Mortgage Type
Purchase Money Mortgage
Purchase Details
Closed on
Apr 30, 2008
Sold by
Reynolds M Barbara M and Reynolds William B
Bought by
Wish Robin V
Create a Home Valuation Report for This Property
The Home Valuation Report is an in-depth analysis detailing your home's value as well as a comparison with similar homes in the area
Home Values in the Area
Average Home Value in this Area
Purchase History
| Date | Buyer | Sale Price | Title Company |
|---|---|---|---|
| Morrison Kevin M | $620,000 | -- | |
| Morrison Kevin M | $620,000 | -- | |
| Laplante James A | $625,000 | -- | |
| Laplante James A | $625,000 | -- | |
| Wish Robin V | $260,000 | -- | |
| Wish Robin V | $260,000 | -- |
Source: Public Records
Mortgage History
| Date | Status | Borrower | Loan Amount |
|---|---|---|---|
| Open | Wish Robin V | $496,000 | |
| Closed | Morrison Kevin M | $496,000 | |
| Previous Owner | Wish Robin V | $417,000 | |
| Previous Owner | Laplante James A | $417,000 |
Source: Public Records
Tax History Compared to Growth
Tax History
| Year | Tax Paid | Tax Assessment Tax Assessment Total Assessment is a certain percentage of the fair market value that is determined by local assessors to be the total taxable value of land and additions on the property. | Land | Improvement |
|---|---|---|---|---|
| 2025 | $14,963 | $1,084,300 | $446,500 | $637,800 |
| 2024 | $13,366 | $913,000 | $402,700 | $510,300 |
| 2023 | $13,097 | $848,800 | $385,200 | $463,600 |
| 2022 | $13,068 | $750,200 | $367,700 | $382,500 |
| 2021 | $12,894 | $726,000 | $364,200 | $361,800 |
| 2020 | $12,604 | $706,900 | $362,400 | $344,500 |
| 2019 | $12,345 | $690,800 | $346,700 | $344,100 |
| 2018 | $11,158 | $655,200 | $337,200 | $318,000 |
| 2017 | $10,990 | $650,700 | $332,700 | $318,000 |
| 2016 | $10,782 | $643,700 | $325,700 | $318,000 |
| 2015 | $9,942 | $619,800 | $316,000 | $303,800 |
| 2014 | $9,691 | $601,200 | $297,400 | $303,800 |
Source: Public Records
Map
Nearby Homes
- 7 Pine Grove Rd
- 4 Pine Grove Rd
- 2 Pine Grove Rd
- 1 Bartlett Ave
- 19 Spring St
- 4 Bartlett Ave
- 9 Pine Grove Rd
- 5 Spring St Unit D
- 5 Spring St Unit C
- 5 Spring St Unit B
- 5 Spring St Unit A
- 5 Spring St
- 5 Spring St Unit B,0
- 25 Spring St
- 10 Pine Grove Rd
- 5-7 Spring St Unit 5-7
- 3 Bartlett Ave
- 8 Black Pine Rd
- 2 Arnold Dr
- 6 Bartlett Ave