Estimated Value: $108,562 - $153,000
--
Bed
1
Bath
864
Sq Ft
$161/Sq Ft
Est. Value
About This Home
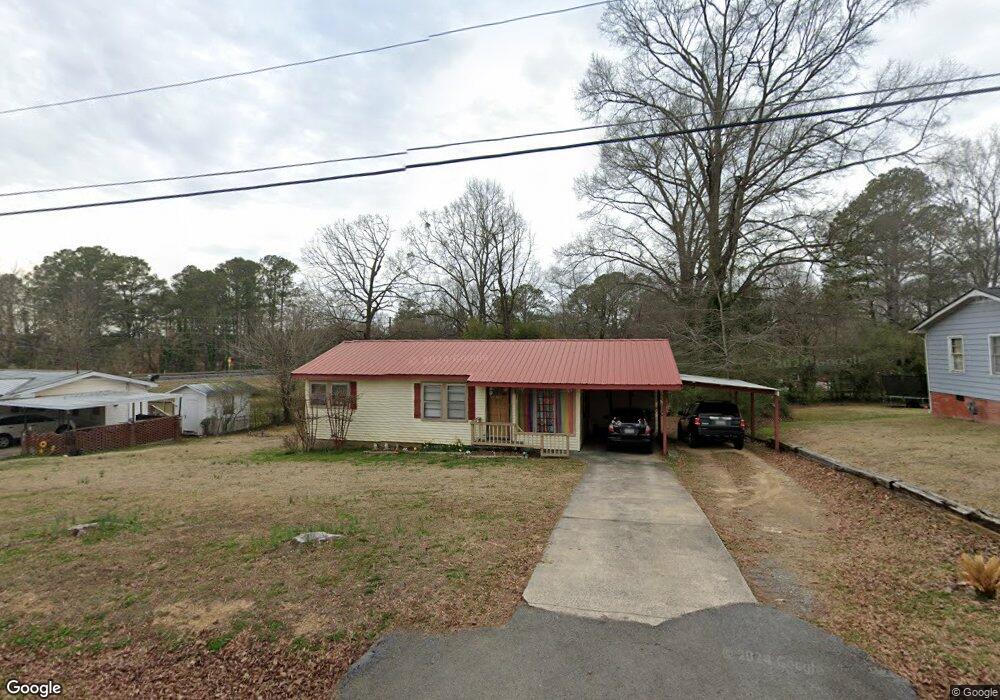
This home is located at 5 Pinecrest Dr NW, Rome, GA 30165 and is currently estimated at $139,391, approximately $161 per square foot. 5 Pinecrest Dr NW is a home located in Floyd County with nearby schools including Coosa Middle School and Coosa High School.
Ownership History
Date
Name
Owned For
Owner Type
Purchase Details
Closed on
May 6, 2021
Sold by
Baker Teresa A
Bought by
Hight Tonya Sha
Current Estimated Value
Purchase Details
Closed on
Mar 31, 2011
Sold by
Smith Brenda L
Bought by
Baker Teresa A
Purchase Details
Closed on
Dec 19, 2006
Sold by
Not Provided
Bought by
Baker Teresa A and Baker Scott A
Purchase Details
Closed on
Jun 16, 1978
Sold by
Smith Robert L
Bought by
P\R
Purchase Details
Closed on
Apr 6, 1976
Sold by
P\R
Bought by
Smith Robert L
Purchase Details
Closed on
May 4, 1972
Sold by
Raburn Sharon
Bought by
P\R
Purchase Details
Closed on
Jan 1, 1971
Sold by
Raburri Charles W
Bought by
Raburn Sharon
Purchase Details
Closed on
Jan 1, 1970
Sold by
Hendon Hemry R
Bought by
Raburri Charles W
Purchase Details
Closed on
Jan 1, 1966
Sold by
Moon Marshall B
Bought by
Hendon Hemry R
Purchase Details
Closed on
Jan 2, 1963
Sold by
Benton B G
Bought by
Moon Marshall B
Purchase Details
Closed on
Jan 1, 1963
Sold by
Talsfarro Orville K
Bought by
Benton B G
Purchase Details
Closed on
Jan 1, 1959
Bought by
Talsfarro Orville K
Create a Home Valuation Report for This Property
The Home Valuation Report is an in-depth analysis detailing your home's value as well as a comparison with similar homes in the area
Home Values in the Area
Average Home Value in this Area
Purchase History
| Date | Buyer | Sale Price | Title Company |
|---|---|---|---|
| Hight Tonya Sha | -- | -- | |
| Baker Teresa A | -- | -- | |
| Baker Teresa A | -- | -- | |
| P\R | -- | -- | |
| Smith Robert L | $13,800 | -- | |
| P\R | -- | -- | |
| Raburn Sharon | -- | -- | |
| Raburri Charles W | -- | -- | |
| Hendon Hemry R | $2,600 | -- | |
| Moon Marshall B | $11,500 | -- | |
| Benton B G | -- | -- | |
| Talsfarro Orville K | -- | -- |
Source: Public Records
Tax History Compared to Growth
Tax History
| Year | Tax Paid | Tax Assessment Tax Assessment Total Assessment is a certain percentage of the fair market value that is determined by local assessors to be the total taxable value of land and additions on the property. | Land | Improvement |
|---|---|---|---|---|
| 2024 | $839 | $26,914 | $8,800 | $18,114 |
| 2023 | $770 | $22,666 | $8,000 | $14,666 |
| 2022 | $553 | $18,644 | $6,400 | $12,244 |
| 2021 | $518 | $17,175 | $6,400 | $10,775 |
| 2020 | $516 | $16,962 | $5,000 | $11,962 |
| 2019 | $489 | $16,266 | $5,000 | $11,266 |
| 2018 | $465 | $15,448 | $5,000 | $10,448 |
| 2017 | $452 | $15,002 | $5,000 | $10,002 |
| 2016 | $450 | $14,753 | $5,000 | $9,753 |
| 2015 | $440 | $14,753 | $5,000 | $9,753 |
| 2014 | $440 | $14,753 | $5,000 | $9,753 |
Source: Public Records
Map
Nearby Homes
- 1 Ann Dr NW
- 4485 Alabama Hwy
- 10 Nest Dr NW
- 293 N Avery Rd NW
- 48 Atwood Dr NW
- 86 N Avery Rd NW
- 53 Northside Dr NW
- 45 Albert Ave NW
- 4813 Alabama Hwy SW
- 87 Northside Dr NW
- 5 Red Fox Dr SW
- 775 Mays Bridge Rd SW
- 26 Red Fox Dr SW
- 43 Brownlow Dr NW
- 0 Charleston Dr NW Unit 10543945
- 0 Charleston Dr NW Unit 7598114
- 16 Polaris Terrace NW
- 33 Cedar Ln NW
- 31 Cedar Ln NW
- 0 Alabama Hwy Unit 10590171
- 3 Pinecrest Dr NW
- 7 Pinecrest Dr NW
- 6 Ann Dr NW
- 6 Pinecrest Dr NW
- 8 Pinecrest Dr NW
- 9 Pinecrest Dr NW
- 0 Pinecrest Dr NW Unit 7394615
- 0 Pinecrest Dr NW Unit 7231017
- 0 Pinecrest Dr NW Unit 7153551
- 0 Pinecrest Dr NW Unit 7083997
- 0 Pinecrest Dr NW Unit 8720900
- 0 Pinecrest Dr NW Unit 8675916
- 0 Pinecrest Dr NW Unit 8627882
- 0 Pinecrest Dr NW Unit 8284178
- 0 Pinecrest Dr NW Unit 7580656
- 0 Pinecrest Dr NW Unit 7139564
- 0 Pinecrest Dr NW Unit 7637766
- 0 Pinecrest Dr NW Unit 7210620
- 0 Pinecrest Dr NW
- 4 Pinecrest Dr NW