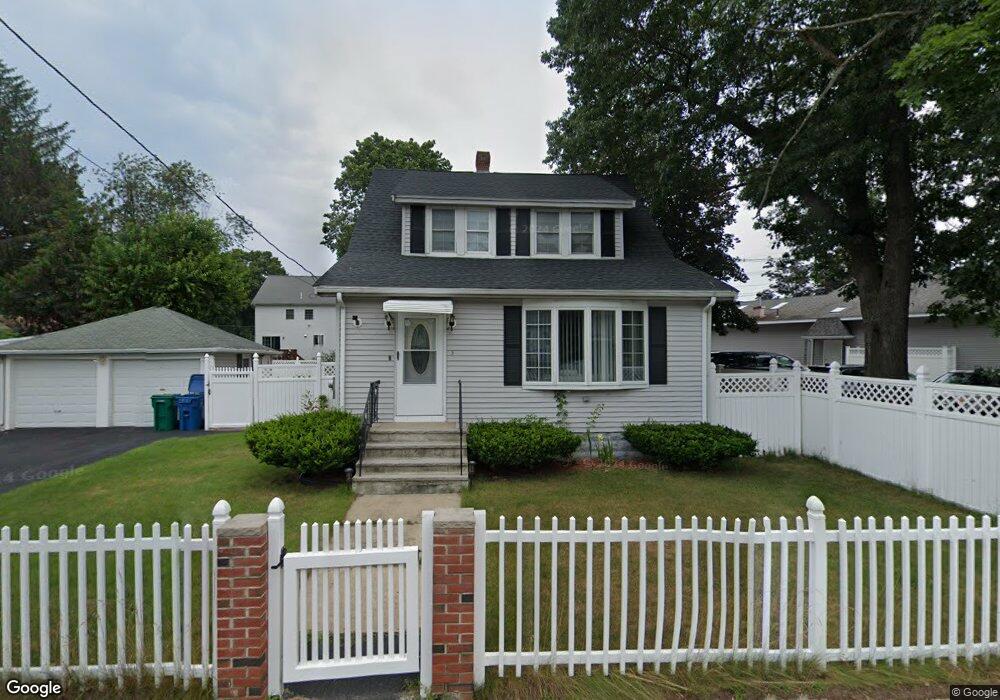
5 Pinegrove Ave Billerica, MA 01821
Pinehurst NeighborhoodEstimated Value: $604,000 - $693,000
3
Beds
1
Bath
2,210
Sq Ft
$297/Sq Ft
Est. Value
About This Home
This home is located at 5 Pinegrove Ave, Billerica, MA 01821 and is currently estimated at $657,242, approximately $297 per square foot. 5 Pinegrove Ave is a home located in Middlesex County with nearby schools including Billerica Memorial High School, Mount Hope Christian School, and Burlington Montessori School.
Ownership History
Date
Name
Owned For
Owner Type
Purchase Details
Closed on
Sep 14, 2021
Sold by
Mahajan Balvir and Mahajan Harsh M
Bought by
Mahajan Ft and Mahajan
Current Estimated Value
Purchase Details
Closed on
Nov 13, 2008
Sold by
Emc Mortgage Corp
Bought by
Mahajan Balvir and Mahajan Harsh
Purchase Details
Closed on
Mar 6, 2008
Sold by
Depas Chantal and Deutsche Bank Natl T C
Bought by
Emc Mortgage Corp
Purchase Details
Closed on
Mar 20, 2006
Sold by
Ranger Neville
Bought by
Depas Chantell and Depas Wilson
Purchase Details
Closed on
Nov 8, 2005
Sold by
Joacine Marie D and Joacine Michelet
Bought by
Ranger Neville
Purchase Details
Closed on
Sep 17, 2004
Sold by
Joacine Marie D
Bought by
Joacine Marie D and Joacine Michelet
Purchase Details
Closed on
Apr 29, 1999
Sold by
Bonaccorsi Anthony and Bonaccorsi Lauren M
Bought by
Joacine Marie D
Create a Home Valuation Report for This Property
The Home Valuation Report is an in-depth analysis detailing your home's value as well as a comparison with similar homes in the area
Home Values in the Area
Average Home Value in this Area
Purchase History
| Date | Buyer | Sale Price | Title Company |
|---|---|---|---|
| Mahajan Ft | -- | None Available | |
| Mahajan Balvir | $235,000 | -- | |
| Emc Mortgage Corp | $323,910 | -- | |
| Depas Chantell | $460,000 | -- | |
| Ranger Neville | $450,000 | -- | |
| Joacine Marie D | -- | -- | |
| Joacine Marie D | $204,900 | -- |
Source: Public Records
Mortgage History
| Date | Status | Borrower | Loan Amount |
|---|---|---|---|
| Previous Owner | Joacine Marie D | $190,000 | |
| Previous Owner | Joacine Marie D | $192,000 |
Source: Public Records
Tax History
| Year | Tax Paid | Tax Assessment Tax Assessment Total Assessment is a certain percentage of the fair market value that is determined by local assessors to be the total taxable value of land and additions on the property. | Land | Improvement |
|---|---|---|---|---|
| 2025 | $6,263 | $550,800 | $278,400 | $272,400 |
| 2024 | $5,804 | $514,100 | $274,600 | $239,500 |
| 2023 | $5,660 | $476,800 | $237,300 | $239,500 |
| 2022 | $5,257 | $415,900 | $204,600 | $211,300 |
| 2021 | $4,963 | $381,800 | $178,800 | $203,000 |
| 2020 | $4,869 | $374,800 | $171,800 | $203,000 |
| 2019 | $4,669 | $346,400 | $171,800 | $174,600 |
| 2018 | $4,493 | $316,600 | $151,100 | $165,500 |
| 2017 | $4,337 | $307,800 | $151,100 | $156,700 |
| 2016 | $4,142 | $292,900 | $139,700 | $153,200 |
| 2015 | $3,938 | $280,500 | $127,300 | $153,200 |
| 2014 | $3,950 | $276,400 | $128,500 | $147,900 |
Source: Public Records
Map
Nearby Homes
Your Personal Tour Guide
Ask me questions while you tour the home.