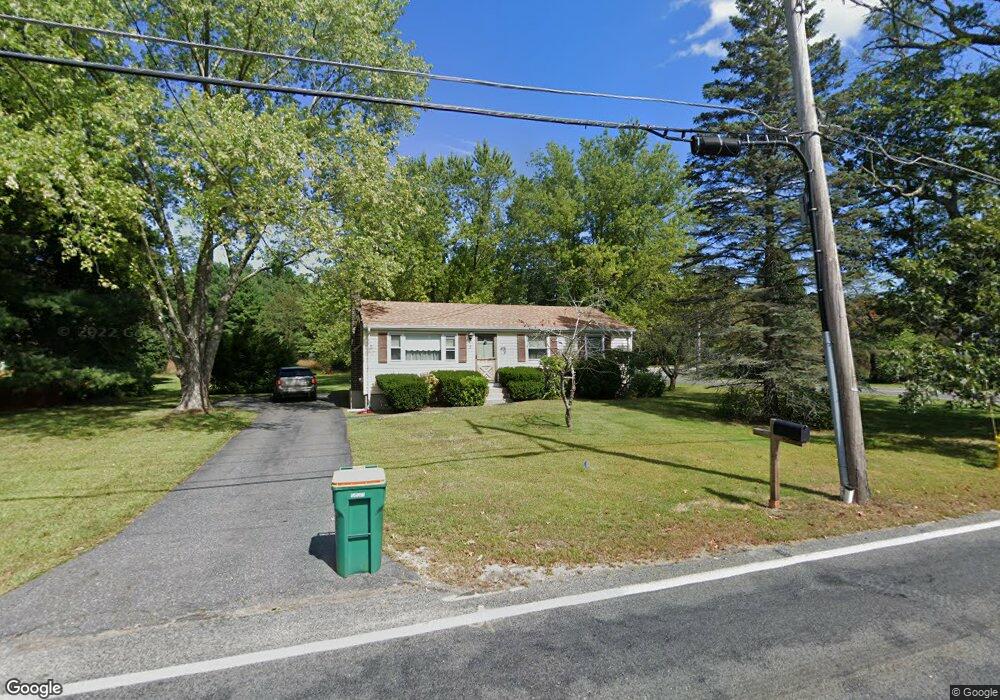
5 Plain St Mansfield, MA 02048
Estimated Value: $497,000 - $588,000
3
Beds
1
Bath
1,040
Sq Ft
$520/Sq Ft
Est. Value
About This Home
This home is located at 5 Plain St, Mansfield, MA 02048 and is currently estimated at $540,677, approximately $519 per square foot. 5 Plain St is a home located in Bristol County with nearby schools including Everett W. Robinson Elementary School, Jordan/Jackson Elementary School, and Harold L. Qualters Middle School.
Ownership History
Date
Name
Owned For
Owner Type
Purchase Details
Closed on
Feb 22, 2013
Sold by
Malewicz Janet T and Malewicz Paul A
Bought by
Malewicz Paul A
Current Estimated Value
Home Financials for this Owner
Home Financials are based on the most recent Mortgage that was taken out on this home.
Original Mortgage
$318,000
Outstanding Balance
$296,750
Interest Rate
2%
Mortgage Type
Reverse Mortgage Home Equity Conversion Mortgage
Estimated Equity
$243,927
Create a Home Valuation Report for This Property
The Home Valuation Report is an in-depth analysis detailing your home's value as well as a comparison with similar homes in the area
Home Values in the Area
Average Home Value in this Area
Purchase History
| Date | Buyer | Sale Price | Title Company |
|---|---|---|---|
| Malewicz Paul A | -- | -- |
Source: Public Records
Mortgage History
| Date | Status | Borrower | Loan Amount |
|---|---|---|---|
| Open | Malewicz Paul A | $318,000 |
Source: Public Records
Tax History
| Year | Tax Paid | Tax Assessment Tax Assessment Total Assessment is a certain percentage of the fair market value that is determined by local assessors to be the total taxable value of land and additions on the property. | Land | Improvement |
|---|---|---|---|---|
| 2025 | $5,525 | $419,500 | $223,500 | $196,000 |
| 2024 | $5,191 | $384,500 | $223,500 | $161,000 |
| 2023 | $5,126 | $363,800 | $223,500 | $140,300 |
| 2022 | $4,977 | $328,100 | $206,900 | $121,200 |
| 2021 | $3,321 | $325,800 | $191,600 | $134,200 |
| 2020 | $5,840 | $321,700 | $191,600 | $130,100 |
| 2019 | $4,513 | $296,500 | $159,600 | $136,900 |
| 2018 | $4,002 | $265,300 | $144,600 | $120,700 |
| 2017 | $4,025 | $268,000 | $140,600 | $127,400 |
| 2016 | $4,071 | $264,200 | $140,800 | $123,400 |
| 2015 | $3,670 | $236,800 | $133,700 | $103,100 |
Source: Public Records
Map
Nearby Homes
- 24 Maverick Dr
- 150 Gilbert St
- 25 Shepherd St
- 25 Munroe Dr
- 128 Tremont St
- 14 Claire Ave
- 115 Westfield Dr
- 84 Messenger St
- 9 Coach Rd
- 17 Childs Ln
- 57 Vine St
- 49 Pheasant Hill Rd
- 33 Colonial Way
- Lot 5 Jeffrey Dr
- 40 Treasure Island Rd
- 451R Gilbert St
- Lot 2 Jeffrey Dr
- 28 Messenger St
- 16 Treasure Island Rd
- 1769 West St
Your Personal Tour Guide
Ask me questions while you tour the home.