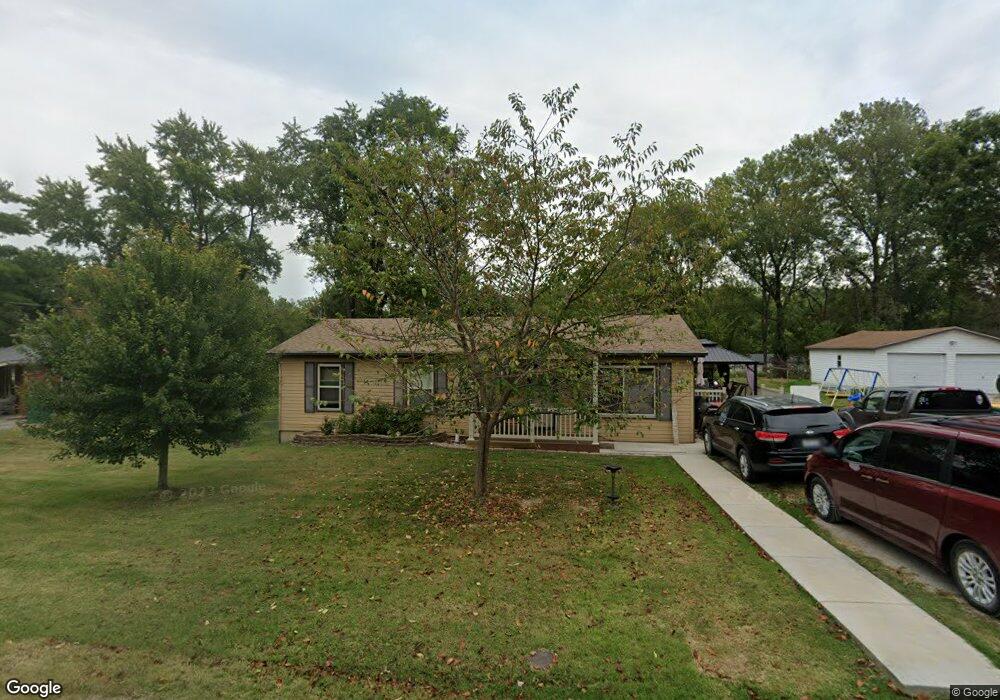
5 Pleasant View Place Caseyville, IL 62232
Estimated Value: $128,797 - $203,000
--
Bed
--
Bath
1,056
Sq Ft
$155/Sq Ft
Est. Value
About This Home
This home is located at 5 Pleasant View Place, Caseyville, IL 62232 and is currently estimated at $163,199, approximately $154 per square foot. 5 Pleasant View Place is a home located in St. Clair County with nearby schools including Twin Echo Elementary School, Dorris Intermediate School, and Collinsville Middle School.
Ownership History
Date
Name
Owned For
Owner Type
Purchase Details
Closed on
Feb 25, 2010
Sold by
Richter Sandra Ann and Kerkemeyer Dawn M
Bought by
Kerkemeyer Dawn M and Kerkemeyer Dennis J
Current Estimated Value
Home Financials for this Owner
Home Financials are based on the most recent Mortgage that was taken out on this home.
Original Mortgage
$81,779
Outstanding Balance
$54,310
Interest Rate
5.02%
Mortgage Type
FHA
Estimated Equity
$108,889
Purchase Details
Closed on
Aug 17, 2007
Sold by
Richter Sandra Ann and Richter Sandra A
Bought by
Kerkemeyer Dawn M and Kerkemeyer Dennis J
Purchase Details
Closed on
Feb 27, 2006
Sold by
Richter Sandra A
Bought by
Richter Sandra A
Purchase Details
Closed on
Mar 5, 2004
Sold by
Schutzenhofer Joann
Bought by
Richter Sandra Ann
Create a Home Valuation Report for This Property
The Home Valuation Report is an in-depth analysis detailing your home's value as well as a comparison with similar homes in the area
Home Values in the Area
Average Home Value in this Area
Purchase History
| Date | Buyer | Sale Price | Title Company |
|---|---|---|---|
| Kerkemeyer Dawn M | -- | None Available | |
| Kerkemeyer Dawn M | -- | None Available | |
| Richter Sandra A | -- | None Available | |
| Richter Sandra Ann | $32,000 | -- |
Source: Public Records
Mortgage History
| Date | Status | Borrower | Loan Amount |
|---|---|---|---|
| Open | Kerkemeyer Dawn M | $81,779 |
Source: Public Records
Tax History Compared to Growth
Tax History
| Year | Tax Paid | Tax Assessment Tax Assessment Total Assessment is a certain percentage of the fair market value that is determined by local assessors to be the total taxable value of land and additions on the property. | Land | Improvement |
|---|---|---|---|---|
| 2024 | $2,489 | $40,048 | $2,061 | $37,987 |
| 2023 | $2,292 | $35,435 | $1,824 | $33,611 |
| 2022 | $2,146 | $33,458 | $1,789 | $31,669 |
| 2021 | $2,086 | $31,756 | $1,698 | $30,058 |
| 2020 | $1,663 | $30,081 | $1,608 | $28,473 |
| 2019 | $1,605 | $30,081 | $1,608 | $28,473 |
| 2018 | $1,372 | $26,414 | $1,719 | $24,695 |
| 2017 | $1,335 | $25,342 | $1,649 | $23,693 |
| 2016 | $1,339 | $24,770 | $1,612 | $23,158 |
| 2014 | $1,480 | $28,313 | $3,909 | $24,404 |
| 2013 | $1,529 | $28,835 | $3,981 | $24,854 |
Source: Public Records
Map
Nearby Homes
- 124 Long Branch Ln
- 1909 Windcrest Dr
- 678 Prato Ct
- 1821 Orr Ln
- 690 Vinci Dr
- 238 Mill St
- 1128 Pisa Dr
- 216 S Chestnut St
- 404 E Church St
- 28 Geneva Dr
- 110 E Church St
- 921 Prospect St
- 6430 Lebanon Rd
- 919 Vine St
- 1012 Crooked Stick Dr
- 121 S Seminary St
- 125 S Hesperia St
- 0 Walker Meadows Subdivision
- 0 Boreal Ridge Subdivision
- 7978 Boreal Ridge
- 7 Pleasant View Place
- 3 Pleasant View Place
- 9 Pleasant View Place
- 4 Pleasant View Place
- 1 Pleasant View Place
- 6 Pleasant View Place
- 2 Pleasant View Place
- 11 Eberhart Dr
- 8 Pleasant View Place
- 11 Pleasant View Place
- 407 Bethel Meadows Rd
- 7 Eberhart Dr
- 10 Pleasant View Place
- 327 Bethel Meadows Rd
- 3 Claydale Place
- 1 Claydale Place
- 16 Eberhart Dr
- 5 Claydale Place
- 20 Eberhart Dr
- 12 Pleasant View Place