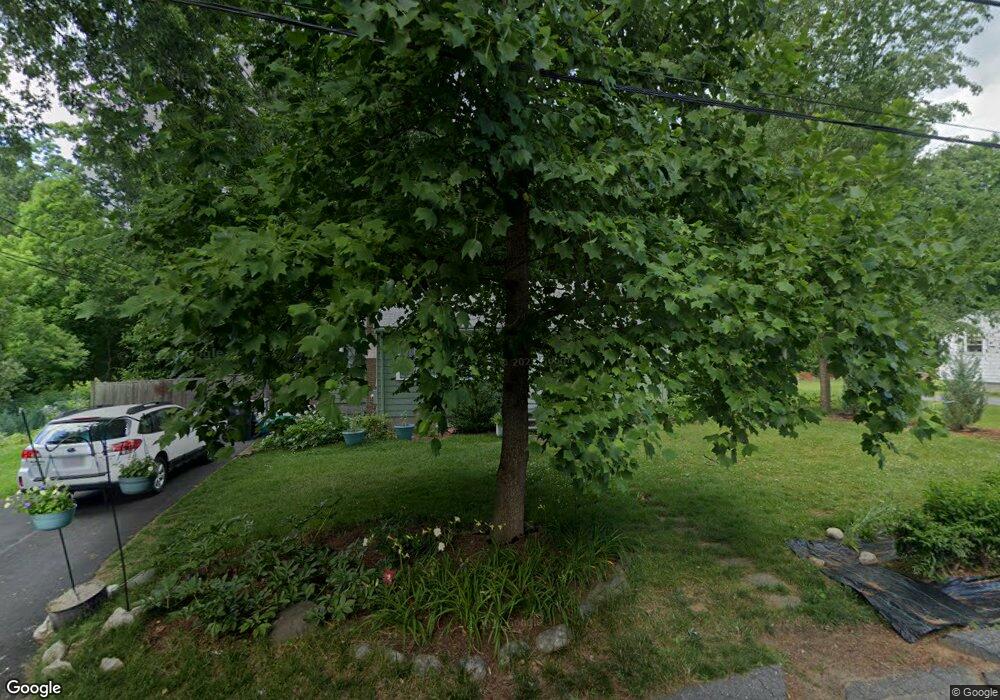
5 Point St Natick, MA 01760
Estimated Value: $505,000 - $815,948
2
Beds
1
Bath
876
Sq Ft
$727/Sq Ft
Est. Value
About This Home
This home is located at 5 Point St, Natick, MA 01760 and is currently estimated at $636,487, approximately $726 per square foot. 5 Point St is a home located in Middlesex County with nearby schools including Natick High School, Johnson Elementary School, and J F Kennedy Middle School.
Ownership History
Date
Name
Owned For
Owner Type
Purchase Details
Closed on
Jan 9, 2013
Sold by
Diana R Doran T R and Diana Doran
Bought by
Doran Kathryn C
Current Estimated Value
Purchase Details
Closed on
Feb 24, 2005
Sold by
Vantage Point Llc
Bought by
Doran Diana R
Purchase Details
Closed on
Aug 6, 2003
Sold by
Thornton Lee S
Bought by
Vantage Point Llc
Purchase Details
Closed on
Apr 30, 2003
Sold by
Priscilla G Cobb Rt and Cobb
Bought by
Thornton Lee S
Home Financials for this Owner
Home Financials are based on the most recent Mortgage that was taken out on this home.
Original Mortgage
$180,000
Interest Rate
5.82%
Mortgage Type
Purchase Money Mortgage
Create a Home Valuation Report for This Property
The Home Valuation Report is an in-depth analysis detailing your home's value as well as a comparison with similar homes in the area
Home Values in the Area
Average Home Value in this Area
Purchase History
| Date | Buyer | Sale Price | Title Company |
|---|---|---|---|
| Doran Kathryn C | $183,750 | -- | |
| Doran Diana R | $232,000 | -- | |
| Doran Diana R | $232,000 | -- | |
| Vantage Point Llc | -- | -- | |
| Vantage Point Llc | -- | -- | |
| Thornton Lee S | $225,000 | -- | |
| Thornton Lee S | $225,000 | -- |
Source: Public Records
Mortgage History
| Date | Status | Borrower | Loan Amount |
|---|---|---|---|
| Previous Owner | Thornton Lee S | $180,000 |
Source: Public Records
Tax History
| Year | Tax Paid | Tax Assessment Tax Assessment Total Assessment is a certain percentage of the fair market value that is determined by local assessors to be the total taxable value of land and additions on the property. | Land | Improvement |
|---|---|---|---|---|
| 2025 | $5,902 | $493,500 | $453,700 | $39,800 |
| 2024 | $5,692 | $464,300 | $426,900 | $37,400 |
| 2023 | $5,602 | $443,200 | $408,300 | $34,900 |
| 2022 | $5,205 | $390,200 | $368,900 | $21,300 |
| 2021 | $5,142 | $377,800 | $347,800 | $30,000 |
| 2020 | $4,927 | $362,000 | $332,000 | $30,000 |
| 2019 | $4,601 | $362,000 | $332,000 | $30,000 |
| 2018 | $4,702 | $360,300 | $316,200 | $44,100 |
| 2017 | $4,426 | $328,100 | $275,200 | $52,900 |
| 2016 | $4,161 | $306,600 | $254,200 | $52,400 |
| 2015 | $4,182 | $302,600 | $254,200 | $48,400 |
Source: Public Records
Map
Nearby Homes
- 79 Speen St
- 1 Fern St
- 28 Sylvester Rd
- 16 West St
- 89 W Central St
- 46 Silver Hill Ln Unit 1
- 26 Wellesley Ave Unit B
- 36 Silver Hill Ln Unit 21
- 62 Oakland St
- 25 Forest Ave
- 3 Silver Hill Ln Unit 6
- 21 Kelsey Rd
- 5 Lanes End
- 1 Post Oak Ln Unit 19
- 58 W Central St
- 63 Pond St
- 216-218 S Main St
- 6 Floral Avenue Extension
- 34 Walden Dr Unit 5
- 8 Walden Dr Unit 13
Your Personal Tour Guide
Ask me questions while you tour the home.