5 Pond St Spencer, MA 01562
Estimated Value: $362,000 - $450,000
6
Beds
3
Baths
2,392
Sq Ft
$176/Sq Ft
Est. Value
About This Home
This home is located at 5 Pond St, Spencer, MA 01562 and is currently estimated at $420,000, approximately $175 per square foot. 5 Pond St is a home located in Worcester County with nearby schools including David Prouty High School.
Ownership History
Date
Name
Owned For
Owner Type
Purchase Details
Closed on
May 10, 2023
Sold by
Lynch Thomas W and Lynch Carol A
Bought by
Thomas W Lynch Irt and Lynch
Current Estimated Value
Purchase Details
Closed on
Sep 23, 2011
Sold by
Lamoureux Jean R and Spencer Sb
Bought by
Lynch Thomas W
Home Financials for this Owner
Home Financials are based on the most recent Mortgage that was taken out on this home.
Original Mortgage
$62,250
Interest Rate
4.33%
Mortgage Type
Purchase Money Mortgage
Purchase Details
Closed on
Aug 25, 1987
Sold by
Lamoureux Ex L M
Bought by
Lamoureux Robert D
Home Financials for this Owner
Home Financials are based on the most recent Mortgage that was taken out on this home.
Original Mortgage
$190,000
Interest Rate
10.29%
Mortgage Type
Purchase Money Mortgage
Create a Home Valuation Report for This Property
The Home Valuation Report is an in-depth analysis detailing your home's value as well as a comparison with similar homes in the area
Home Values in the Area
Average Home Value in this Area
Purchase History
| Date | Buyer | Sale Price | Title Company |
|---|---|---|---|
| Thomas W Lynch Irt | -- | None Available | |
| Lynch Thomas W | $83,000 | -- | |
| Lamoureux Robert D | $122,000 | -- |
Source: Public Records
Mortgage History
| Date | Status | Borrower | Loan Amount |
|---|---|---|---|
| Previous Owner | Lynch Thomas W | $62,250 | |
| Previous Owner | Lamoureux Robert D | $15,000 | |
| Previous Owner | Lamoureux Robert D | $190,000 |
Source: Public Records
Tax History Compared to Growth
Tax History
| Year | Tax Paid | Tax Assessment Tax Assessment Total Assessment is a certain percentage of the fair market value that is determined by local assessors to be the total taxable value of land and additions on the property. | Land | Improvement |
|---|---|---|---|---|
| 2025 | $34 | $293,100 | $36,000 | $257,100 |
| 2024 | $3,138 | $274,300 | $36,000 | $238,300 |
| 2023 | $2,992 | $248,100 | $36,000 | $212,100 |
| 2022 | $2,928 | $222,500 | $32,800 | $189,700 |
| 2021 | $2,888 | $205,700 | $32,800 | $172,900 |
| 2020 | $2,746 | $194,500 | $32,800 | $161,700 |
| 2019 | $2,328 | $168,000 | $29,500 | $138,500 |
| 2018 | $2,056 | $153,200 | $34,400 | $118,800 |
| 2017 | $2,119 | $151,600 | $32,800 | $118,800 |
| 2016 | $2,019 | $141,300 | $32,800 | $108,500 |
| 2015 | $2,053 | $150,200 | $38,000 | $112,200 |
| 2014 | $1,975 | $150,200 | $38,000 | $112,200 |
Source: Public Records
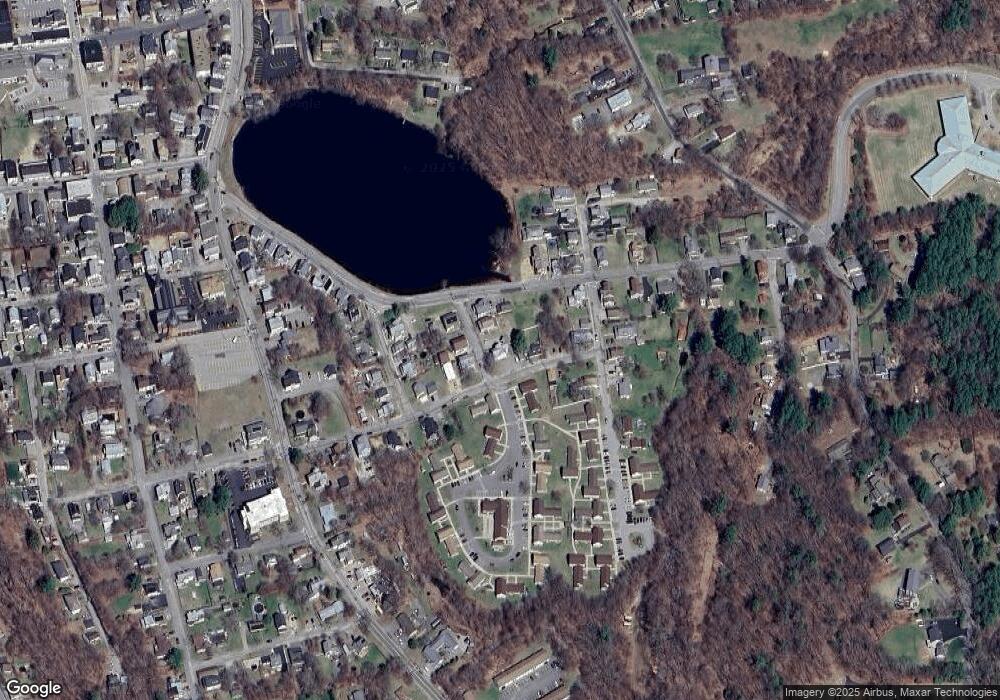
Map
Nearby Homes