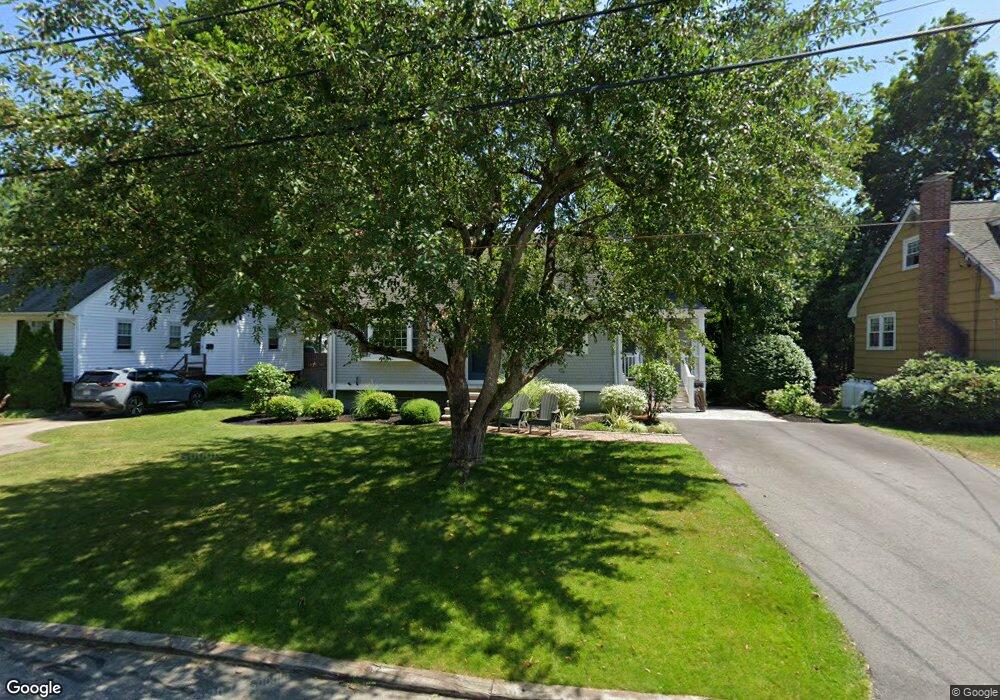
5 Poplar St Framingham, MA 01701
Nobscot NeighborhoodEstimated Value: $582,000 - $649,000
3
Beds
2
Baths
1,374
Sq Ft
$451/Sq Ft
Est. Value
About This Home
This home is located at 5 Poplar St, Framingham, MA 01701 and is currently estimated at $619,089, approximately $450 per square foot. 5 Poplar St is a home located in Middlesex County with nearby schools including Framingham High School, Summit Montessori School, and Saint Bridget School.
Ownership History
Date
Name
Owned For
Owner Type
Purchase Details
Closed on
Feb 24, 2005
Sold by
Williams Adele C and Williams Peter G
Bought by
Dube Jill A and Dube Steven G
Current Estimated Value
Home Financials for this Owner
Home Financials are based on the most recent Mortgage that was taken out on this home.
Original Mortgage
$278,350
Outstanding Balance
$142,236
Interest Rate
5.73%
Mortgage Type
Purchase Money Mortgage
Estimated Equity
$476,853
Purchase Details
Closed on
Sep 18, 1996
Sold by
Broadwin Edward S and Broadwin Andrea R
Bought by
Williams Peter G and Williams Adele C
Create a Home Valuation Report for This Property
The Home Valuation Report is an in-depth analysis detailing your home's value as well as a comparison with similar homes in the area
Home Values in the Area
Average Home Value in this Area
Purchase History
| Date | Buyer | Sale Price | Title Company |
|---|---|---|---|
| Dube Jill A | $348,000 | -- | |
| Dube Jill A | $348,000 | -- | |
| Williams Peter G | $168,500 | -- |
Source: Public Records
Mortgage History
| Date | Status | Borrower | Loan Amount |
|---|---|---|---|
| Open | Dube Jill A | $278,350 | |
| Closed | Williams Peter G | $278,350 | |
| Previous Owner | Williams Peter G | $20,000 |
Source: Public Records
Tax History Compared to Growth
Tax History
| Year | Tax Paid | Tax Assessment Tax Assessment Total Assessment is a certain percentage of the fair market value that is determined by local assessors to be the total taxable value of land and additions on the property. | Land | Improvement |
|---|---|---|---|---|
| 2025 | $6,691 | $560,400 | $260,700 | $299,700 |
| 2024 | $6,520 | $523,300 | $232,800 | $290,500 |
| 2023 | $6,227 | $475,700 | $207,800 | $267,900 |
| 2022 | $5,888 | $428,500 | $188,500 | $240,000 |
| 2021 | $5,381 | $383,000 | $181,200 | $201,800 |
| 2020 | $5,405 | $360,800 | $164,700 | $196,100 |
| 2019 | $5,266 | $342,400 | $164,700 | $177,700 |
| 2018 | $4,981 | $305,200 | $158,500 | $146,700 |
| 2017 | $4,883 | $292,200 | $153,900 | $138,300 |
| 2016 | $4,715 | $271,300 | $153,900 | $117,400 |
| 2015 | $4,674 | $262,300 | $154,200 | $108,100 |
Source: Public Records
Map
Nearby Homes