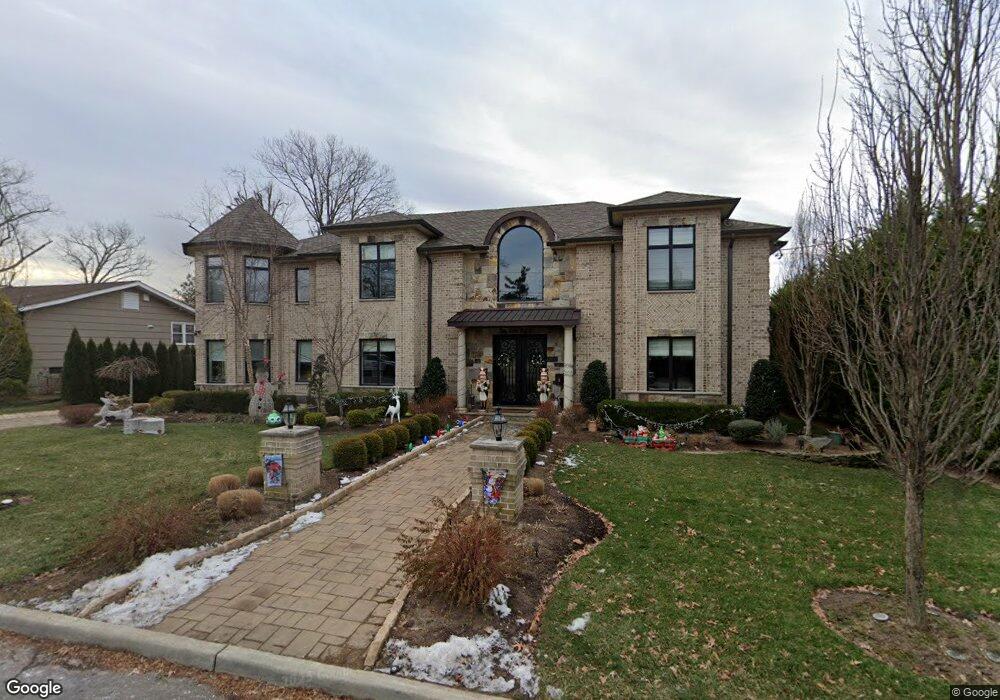
5 Priscilla Ln Englewood Cliffs, NJ 07632
Estimated Value: $3,457,000 - $3,866,000
7
Beds
8
Baths
5,456
Sq Ft
$673/Sq Ft
Est. Value
About This Home
This home is located at 5 Priscilla Ln, Englewood Cliffs, NJ 07632 and is currently estimated at $3,669,783, approximately $672 per square foot. 5 Priscilla Ln is a home located in Bergen County with nearby schools including North Cliff Elementary School, Upper School Elementary School, and Englewood on the Palisades Charter School.
Ownership History
Date
Name
Owned For
Owner Type
Purchase Details
Closed on
Dec 28, 2016
Sold by
Senatore Brunelli Builders Llc
Bought by
Amador Roberto Antonio
Current Estimated Value
Purchase Details
Closed on
Jul 25, 2014
Sold by
Reduce Ronald
Bought by
Senatore Brunelli Builders Llc
Purchase Details
Closed on
May 5, 2010
Sold by
Muskat William H and Muskat Lillian
Bought by
Reduce Ronald
Create a Home Valuation Report for This Property
The Home Valuation Report is an in-depth analysis detailing your home's value as well as a comparison with similar homes in the area
Home Values in the Area
Average Home Value in this Area
Purchase History
| Date | Buyer | Sale Price | Title Company |
|---|---|---|---|
| Amador Roberto Antonio | $2,450,000 | None Available | |
| Senatore Brunelli Builders Llc | $1,175,000 | -- | |
| Reduce Ronald | $910,000 | -- |
Source: Public Records
Tax History Compared to Growth
Tax History
| Year | Tax Paid | Tax Assessment Tax Assessment Total Assessment is a certain percentage of the fair market value that is determined by local assessors to be the total taxable value of land and additions on the property. | Land | Improvement |
|---|---|---|---|---|
| 2025 | $28,298 | $2,450,000 | $1,050,000 | $1,400,000 |
| 2024 | $27,955 | $2,450,000 | $1,050,000 | $1,400,000 |
| 2023 | $27,514 | $2,450,000 | $1,050,000 | $1,400,000 |
| 2022 | $27,514 | $2,450,000 | $1,050,000 | $1,400,000 |
| 2021 | $27,538 | $2,450,000 | $1,050,000 | $1,400,000 |
| 2020 | $28,200 | $2,450,000 | $1,050,000 | $1,400,000 |
| 2019 | $26,485 | $2,450,000 | $1,050,000 | $1,400,000 |
| 2018 | $25,554 | $2,450,000 | $1,050,000 | $1,400,000 |
| 2017 | $25,990 | $2,604,200 | $1,050,000 | $1,554,200 |
| 2016 | $29,313 | $2,994,200 | $1,050,000 | $1,944,200 |
| 2015 | $9,765 | $1,050,000 | $1,050,000 | $0 |
| 2014 | $9,135 | $1,050,000 | $1,050,000 | $0 |
Source: Public Records
Map
Nearby Homes