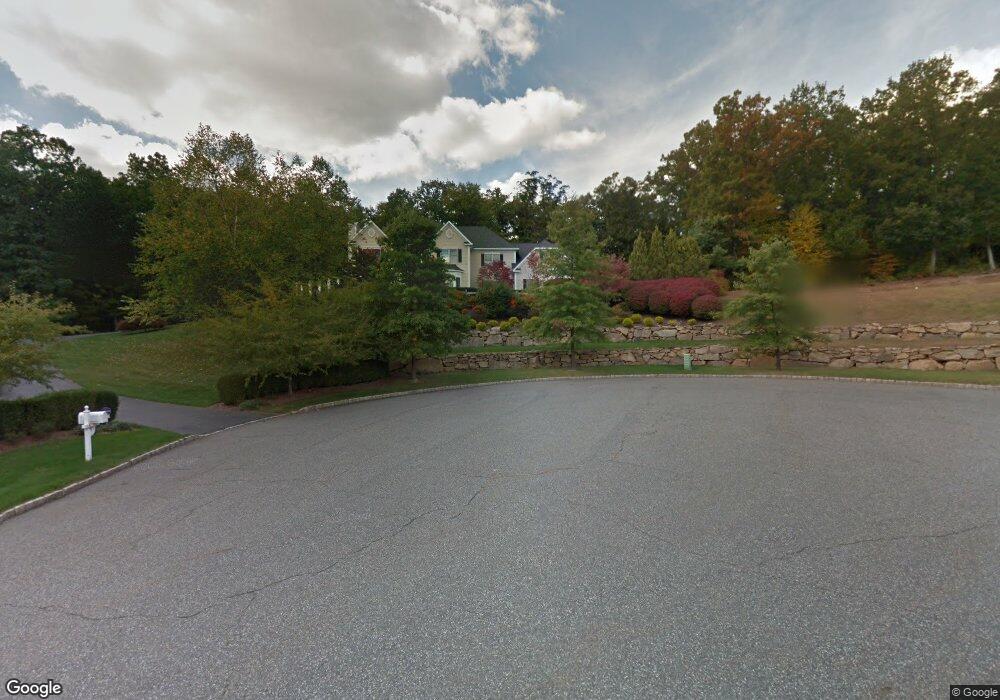
5 Rabbit Run Rockaway, NJ 07866
Estimated Value: $1,173,000 - $1,663,000
Studio
--
Bath
4,982
Sq Ft
$291/Sq Ft
Est. Value
About This Home
This home is located at 5 Rabbit Run, Rockaway, NJ 07866 and is currently estimated at $1,448,220, approximately $290 per square foot. 5 Rabbit Run is a home located in Morris County with nearby schools including Katherine D. Malone School, Copeland Middle School, and Divine Mercy Academy.
Ownership History
Date
Name
Owned For
Owner Type
Purchase Details
Closed on
Nov 15, 2005
Sold by
Reiken Samuel
Bought by
Schiffere Mark and Schiffer Marcia
Current Estimated Value
Home Financials for this Owner
Home Financials are based on the most recent Mortgage that was taken out on this home.
Original Mortgage
$400,000
Outstanding Balance
$218,129
Interest Rate
6.06%
Mortgage Type
New Conventional
Estimated Equity
$1,230,091
Purchase Details
Closed on
Oct 30, 2002
Sold by
Meriden Estates
Bought by
Reiken Sam and Reiken Sandi
Home Financials for this Owner
Home Financials are based on the most recent Mortgage that was taken out on this home.
Original Mortgage
$573,500
Interest Rate
6.16%
Create a Home Valuation Report for This Property
The Home Valuation Report is an in-depth analysis detailing your home's value as well as a comparison with similar homes in the area
Home Values in the Area
Average Home Value in this Area
Purchase History
| Date | Buyer | Sale Price | Title Company |
|---|---|---|---|
| Schiffere Mark | $1,132,500 | -- | |
| Reiken Sam | $720,297 | -- |
Source: Public Records
Mortgage History
| Date | Status | Borrower | Loan Amount |
|---|---|---|---|
| Open | Schiffere Mark | $400,000 | |
| Previous Owner | Reiken Sam | $573,500 |
Source: Public Records
Tax History
| Year | Tax Paid | Tax Assessment Tax Assessment Total Assessment is a certain percentage of the fair market value that is determined by local assessors to be the total taxable value of land and additions on the property. | Land | Improvement |
|---|---|---|---|---|
| 2025 | $25,420 | $1,076,900 | $296,600 | $780,300 |
| 2024 | $23,196 | $991,400 | $254,200 | $737,200 |
| 2023 | $23,196 | $884,000 | $229,100 | $654,900 |
| 2022 | $15,279 | $835,600 | $211,100 | $624,500 |
| 2021 | $15,279 | $734,700 | $203,600 | $531,100 |
| 2020 | $22,305 | $785,100 | $201,100 | $584,000 |
| 2019 | $22,930 | $803,700 | $196,100 | $607,600 |
| 2018 | $23,302 | $803,800 | $221,200 | $582,600 |
| 2017 | $22,716 | $727,600 | $232,200 | $495,400 |
| 2016 | $22,425 | $727,600 | $232,200 | $495,400 |
| 2015 | $22,265 | $727,600 | $232,200 | $495,400 |
| 2014 | $21,850 | $727,600 | $232,200 | $495,400 |
Source: Public Records
Map
Nearby Homes
- 126 Meriden Rd
- 169 Green Pond Rd
- 338 Green Pond Rd
- 119 Green Pond Rd
- 28 Miller Dr
- 41 Comanche Ave
- 25 Sunset Trail
- 47 Cherokee Ave
- 18 Erie Ave
- 541 Green Pond Rd
- 1310 Parkview Ln
- 175 Cedar Lake E
- 1 Colonial Rd
- 15 Winding Brook Way
- 16 Valley View Dr
- 30 Edgewater Dr
- 9 Hillview Terrace
- 216 Jackson Ave
- 12 Overlook Dr
- 51 Mountain Ave
Your Personal Tour Guide
Ask me questions while you tour the home.