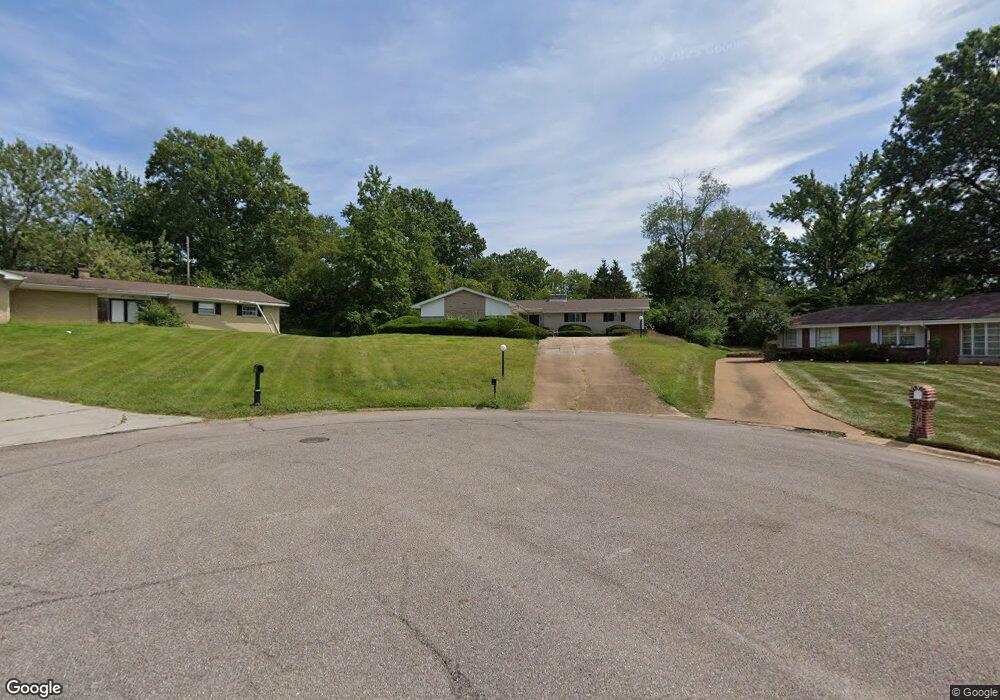
5 Ranch Ct Florissant, MO 63033
Estimated Value: $235,586 - $250,000
3
Beds
3
Baths
2,187
Sq Ft
$111/Sq Ft
Est. Value
About This Home
This home is located at 5 Ranch Ct, Florissant, MO 63033 and is currently estimated at $242,897, approximately $111 per square foot. 5 Ranch Ct is a home located in St. Louis County with nearby schools including Townsend Elementary School, Central Middle School, and Hazelwood Central High School.
Ownership History
Date
Name
Owned For
Owner Type
Purchase Details
Closed on
Nov 21, 2001
Sold by
Samuel Garland E and Smith Samuel Patricia
Bought by
Samuel Garland E
Current Estimated Value
Home Financials for this Owner
Home Financials are based on the most recent Mortgage that was taken out on this home.
Original Mortgage
$111,997
Outstanding Balance
$45,159
Interest Rate
7.15%
Mortgage Type
FHA
Estimated Equity
$197,738
Purchase Details
Closed on
Mar 22, 1999
Sold by
Diehl Dorothy M and Gromm Mary F
Bought by
Gromm Gregory W and Gromm Mary Ellen
Purchase Details
Closed on
Dec 30, 1998
Sold by
Dickson Gerald H and Dickson Virginia J
Bought by
Samuel Garland E and Smith Samuel Patricia
Home Financials for this Owner
Home Financials are based on the most recent Mortgage that was taken out on this home.
Original Mortgage
$114,941
Interest Rate
6.74%
Mortgage Type
FHA
Create a Home Valuation Report for This Property
The Home Valuation Report is an in-depth analysis detailing your home's value as well as a comparison with similar homes in the area
Home Values in the Area
Average Home Value in this Area
Purchase History
| Date | Buyer | Sale Price | Title Company |
|---|---|---|---|
| Samuel Garland E | -- | -- | |
| Gromm Gregory W | -- | -- | |
| Samuel Garland E | $115,000 | -- |
Source: Public Records
Mortgage History
| Date | Status | Borrower | Loan Amount |
|---|---|---|---|
| Open | Samuel Garland E | $111,997 | |
| Previous Owner | Samuel Garland E | $114,941 |
Source: Public Records
Tax History Compared to Growth
Tax History
| Year | Tax Paid | Tax Assessment Tax Assessment Total Assessment is a certain percentage of the fair market value that is determined by local assessors to be the total taxable value of land and additions on the property. | Land | Improvement |
|---|---|---|---|---|
| 2025 | $3,106 | $47,590 | $4,860 | $42,730 |
| 2024 | $3,106 | $34,390 | $4,860 | $29,530 |
| 2023 | $3,095 | $34,390 | $4,860 | $29,530 |
| 2022 | $3,555 | $35,190 | $8,460 | $26,730 |
| 2021 | $3,363 | $35,190 | $8,460 | $26,730 |
| 2020 | $3,021 | $29,430 | $6,310 | $23,120 |
| 2019 | $2,998 | $29,430 | $6,310 | $23,120 |
| 2018 | $2,877 | $26,110 | $4,430 | $21,680 |
| 2017 | $2,874 | $26,110 | $4,430 | $21,680 |
| 2016 | $3,452 | $30,900 | $3,270 | $27,630 |
| 2015 | $3,372 | $30,900 | $3,270 | $27,630 |
| 2014 | $2,973 | $27,090 | $3,020 | $24,070 |
Source: Public Records
Map
Nearby Homes
- 11757 Vizcuya Ct
- 11760 Sheffield Dr
- 11440 Sheffield Dr
- 6530 Farm Pond Ct
- 6250 Pennyrich Ct
- 11774 El Somo Ct
- 12136 La Padera Ln
- 11905 Rosevalley Ln
- 12065 El Camara Dr
- 12095 El Camara Dr
- 1911 Redman Rd
- 12320 Missile Ln
- 17 Nob Hill Dr
- 1730 Parktree Ln
- 6480 Hadden Bay Dr
- 11377 Fox Hall Ln
- 6320 Hadden Bay Dr
- 2291 Redman Rd
- 11951 Jerries Ln
- 12223 Fontaine Ln