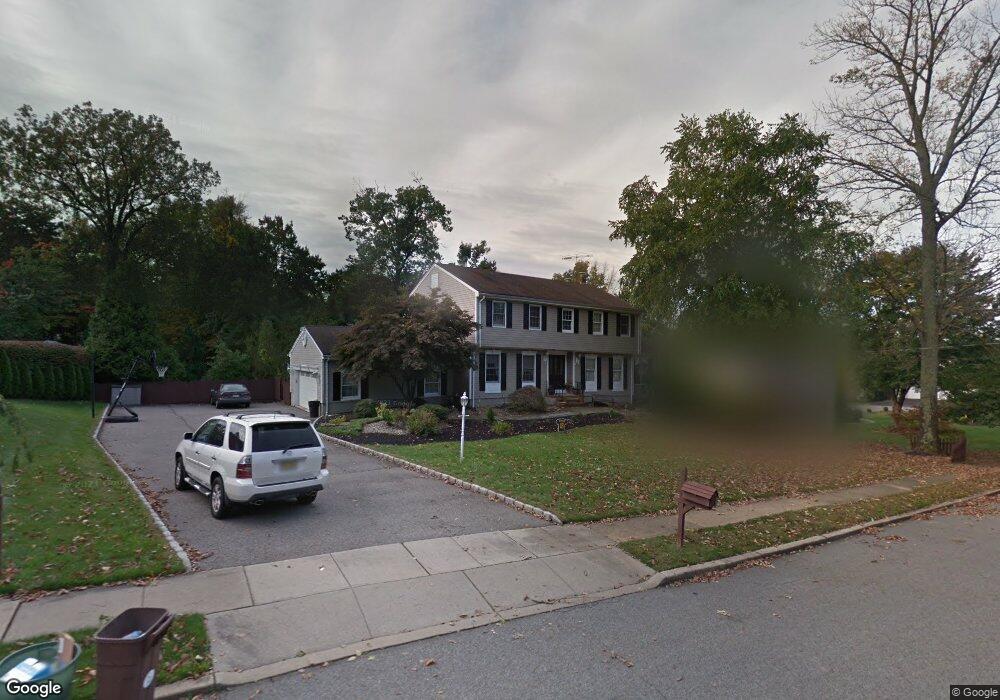
5 Rand Rd Pine Brook, NJ 07058
Estimated Value: $964,000 - $1,129,000
Studio
--
Bath
3,074
Sq Ft
$343/Sq Ft
Est. Value
About This Home
This home is located at 5 Rand Rd, Pine Brook, NJ 07058 and is currently estimated at $1,055,761, approximately $343 per square foot. 5 Rand Rd is a home located in Morris County with nearby schools including Montville Township High School and Trinity Christian School.
Ownership History
Date
Name
Owned For
Owner Type
Purchase Details
Closed on
Apr 9, 2014
Sold by
Glasser Steven S and Glasser Zully M
Bought by
Glasser Zully M
Current Estimated Value
Purchase Details
Closed on
May 5, 2004
Sold by
Rienzi Vincent
Bought by
Glasser Steven and Glasser Zully
Home Financials for this Owner
Home Financials are based on the most recent Mortgage that was taken out on this home.
Original Mortgage
$285,000
Outstanding Balance
$135,971
Interest Rate
5.75%
Estimated Equity
$919,790
Create a Home Valuation Report for This Property
The Home Valuation Report is an in-depth analysis detailing your home's value as well as a comparison with similar homes in the area
Home Values in the Area
Average Home Value in this Area
Purchase History
| Date | Buyer | Sale Price | Title Company |
|---|---|---|---|
| Glasser Zully M | -- | None Available | |
| Glasser Steven | $705,000 | -- |
Source: Public Records
Mortgage History
| Date | Status | Borrower | Loan Amount |
|---|---|---|---|
| Open | Glasser Steven | $285,000 |
Source: Public Records
Tax History
| Year | Tax Paid | Tax Assessment Tax Assessment Total Assessment is a certain percentage of the fair market value that is determined by local assessors to be the total taxable value of land and additions on the property. | Land | Improvement |
|---|---|---|---|---|
| 2025 | $17,605 | $661,600 | $248,500 | $413,100 |
| 2024 | $17,235 | $661,600 | $248,500 | $413,100 |
| 2023 | $17,235 | $661,600 | $248,500 | $413,100 |
| 2022 | $16,705 | $661,600 | $248,500 | $413,100 |
| 2021 | $16,705 | $661,600 | $248,500 | $413,100 |
| 2020 | $16,355 | $661,600 | $248,500 | $413,100 |
| 2019 | $16,070 | $661,600 | $248,500 | $413,100 |
| 2018 | $15,918 | $661,600 | $248,500 | $413,100 |
| 2017 | $15,515 | $661,600 | $248,500 | $413,100 |
| 2016 | $15,184 | $661,600 | $248,500 | $413,100 |
| 2015 | $14,939 | $661,600 | $248,500 | $413,100 |
| 2014 | $14,727 | $661,600 | $248,500 | $413,100 |
Source: Public Records
Map
Nearby Homes
- 53 Woodmont Rd
- 10 Stuart Ct
- 67 Hook Mountain Rd
- 130 Konner Ave
- 32 Sylvan Dr
- 4 Lancaster Ave
- 11 Merlin Place
- 34 Horseneck Rd
- 410 Horseneck Rd
- 10 Flanders Dr
- 7 Carlson Place
- 32 Lake Shore Dr
- 34 Bloomfield Ave
- 171 Old Bloomfield Ave
- 63 U S 46
- 22 Fawn Dr
- 73 Big Piece Rd
- 8 John St
- 29 Long Acres Rd
- 8 Winfield Ct
Your Personal Tour Guide
Ask me questions while you tour the home.