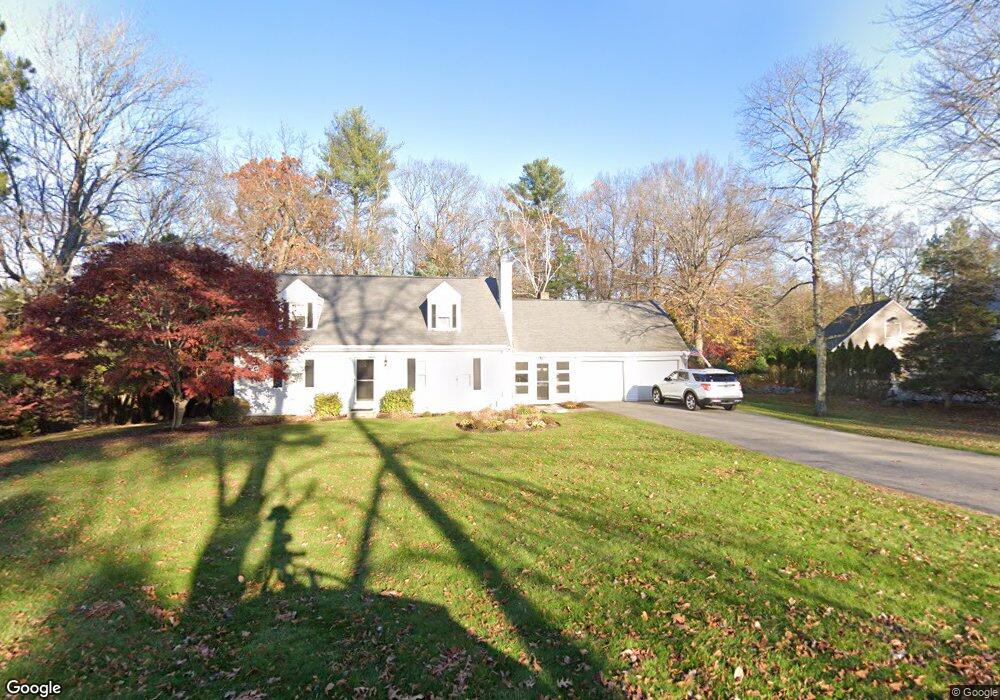
5 Red Gate Ln Southborough, MA 01772
Estimated Value: $830,267 - $1,169,000
3
Beds
3
Baths
2,315
Sq Ft
$416/Sq Ft
Est. Value
About This Home
This home is located at 5 Red Gate Ln, Southborough, MA 01772 and is currently estimated at $964,067, approximately $416 per square foot. 5 Red Gate Ln is a home located in Worcester County with nearby schools including Mary E Finn School, Margaret A. Neary School, and Albert S. Woodward Memorial School.
Ownership History
Date
Name
Owned For
Owner Type
Purchase Details
Closed on
Jun 2, 1995
Sold by
Anghinetti Mary A
Bought by
Tricomi Ralph and Tricomi Lynda
Current Estimated Value
Home Financials for this Owner
Home Financials are based on the most recent Mortgage that was taken out on this home.
Original Mortgage
$235,000
Interest Rate
8.2%
Mortgage Type
Purchase Money Mortgage
Create a Home Valuation Report for This Property
The Home Valuation Report is an in-depth analysis detailing your home's value as well as a comparison with similar homes in the area
Home Values in the Area
Average Home Value in this Area
Purchase History
| Date | Buyer | Sale Price | Title Company |
|---|---|---|---|
| Tricomi Ralph | $264,500 | -- |
Source: Public Records
Mortgage History
| Date | Status | Borrower | Loan Amount |
|---|---|---|---|
| Closed | Tricomi Ralph | $235,000 |
Source: Public Records
Tax History
| Year | Tax Paid | Tax Assessment Tax Assessment Total Assessment is a certain percentage of the fair market value that is determined by local assessors to be the total taxable value of land and additions on the property. | Land | Improvement |
|---|---|---|---|---|
| 2025 | $9,864 | $714,300 | $349,100 | $365,200 |
| 2024 | $9,677 | $695,700 | $344,300 | $351,400 |
| 2023 | $9,126 | $618,300 | $326,000 | $292,300 |
| 2022 | $8,755 | $537,800 | $284,200 | $253,600 |
| 2021 | $8,823 | $544,300 | $288,700 | $255,600 |
| 2020 | $8,737 | $524,400 | $283,200 | $241,200 |
| 2019 | $8,472 | $506,100 | $267,600 | $238,500 |
| 2018 | $2,479 | $489,500 | $258,000 | $231,500 |
| 2017 | $8,015 | $489,300 | $258,000 | $231,300 |
| 2016 | $7,969 | $503,700 | $253,300 | $250,400 |
| 2015 | $7,837 | $489,200 | $238,500 | $250,700 |
Source: Public Records
Map
Nearby Homes
- 14 Lovers Ln
- 6 Eastbrook Farm Ln
- 20 Clifford Rd
- 14 Sarsenstone Way
- 12 Wyndemere Dr
- 8 Rock Spring Ln
- 32 Sears Rd
- 56 Sears Rd
- 4 Latisquama Rd
- lot 1 Sears Rd
- 5 Foxhill Dr
- 17 Walker St
- 44 Gilmore Rd
- 9A Ashley Rd
- 10 Lorenzo Dr
- 15 Jacob Amsden Rd
- 150 Framingham Rd
- 3 Leonard Dr
- 2 Spring Meadow Dr
- 19 Maplecrest Dr
Your Personal Tour Guide
Ask me questions while you tour the home.