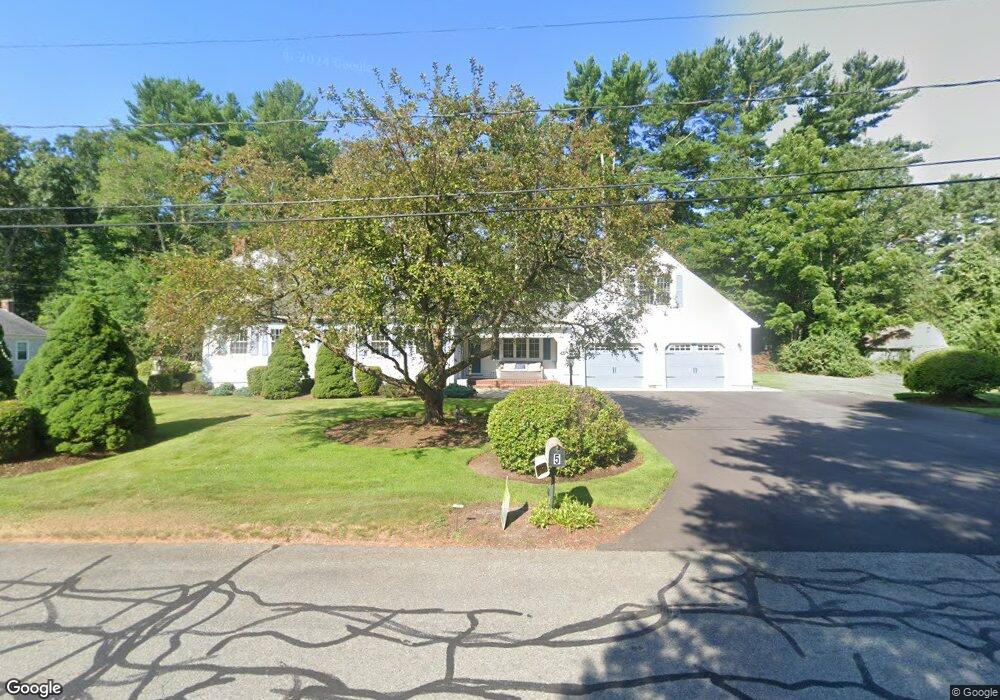
5 Rene St Acushnet, MA 02743
Estimated Value: $513,000 - $588,000
--
Bed
2
Baths
1,988
Sq Ft
$280/Sq Ft
Est. Value
About This Home
This home is located at 5 Rene St, Acushnet, MA 02743 and is currently estimated at $555,977, approximately $279 per square foot. 5 Rene St is a home located in Bristol County with nearby schools including Acushnet Elementary School, Albert F Ford Middle School, and Alma Del Mar Charter School.
Ownership History
Date
Name
Owned For
Owner Type
Purchase Details
Closed on
Apr 27, 2017
Sold by
Pelletier David A and Pelletier Rochelle L
Bought by
David A A and David L R
Current Estimated Value
Purchase Details
Closed on
Nov 8, 1996
Sold by
Maiato Dinarte and Maiato Gertrude
Bought by
Pelletier David A and Pelletier Rochelle L
Purchase Details
Closed on
Oct 18, 1993
Sold by
Roderick Glorianna A
Bought by
Maiato Dinarte and Maiato Gertrude
Create a Home Valuation Report for This Property
The Home Valuation Report is an in-depth analysis detailing your home's value as well as a comparison with similar homes in the area
Home Values in the Area
Average Home Value in this Area
Purchase History
| Date | Buyer | Sale Price | Title Company |
|---|---|---|---|
| David A A | -- | -- | |
| Pelletier David A | $148,000 | -- | |
| Maiato Dinarte | $115,000 | -- |
Source: Public Records
Mortgage History
| Date | Status | Borrower | Loan Amount |
|---|---|---|---|
| Previous Owner | Maiato Dinarte | $24,743 | |
| Previous Owner | Maiato Dinarte | $63,000 | |
| Previous Owner | Maiato Dinarte | $23,753 |
Source: Public Records
Tax History Compared to Growth
Tax History
| Year | Tax Paid | Tax Assessment Tax Assessment Total Assessment is a certain percentage of the fair market value that is determined by local assessors to be the total taxable value of land and additions on the property. | Land | Improvement |
|---|---|---|---|---|
| 2025 | $50 | $462,200 | $124,800 | $337,400 |
| 2024 | $4,675 | $409,700 | $118,000 | $291,700 |
| 2023 | $4,565 | $380,400 | $102,100 | $278,300 |
| 2022 | $4,323 | $325,800 | $97,600 | $228,200 |
| 2021 | $4,254 | $307,600 | $97,600 | $210,000 |
| 2020 | $4,041 | $289,900 | $97,600 | $192,300 |
| 2019 | $4,003 | $282,300 | $99,900 | $182,400 |
| 2018 | $3,879 | $269,000 | $99,900 | $169,100 |
| 2017 | $3,740 | $259,000 | $99,900 | $159,100 |
| 2016 | $3,425 | $235,700 | $93,100 | $142,600 |
| 2015 | $3,337 | $233,700 | $93,100 | $140,600 |
Source: Public Records
Map
Nearby Homes