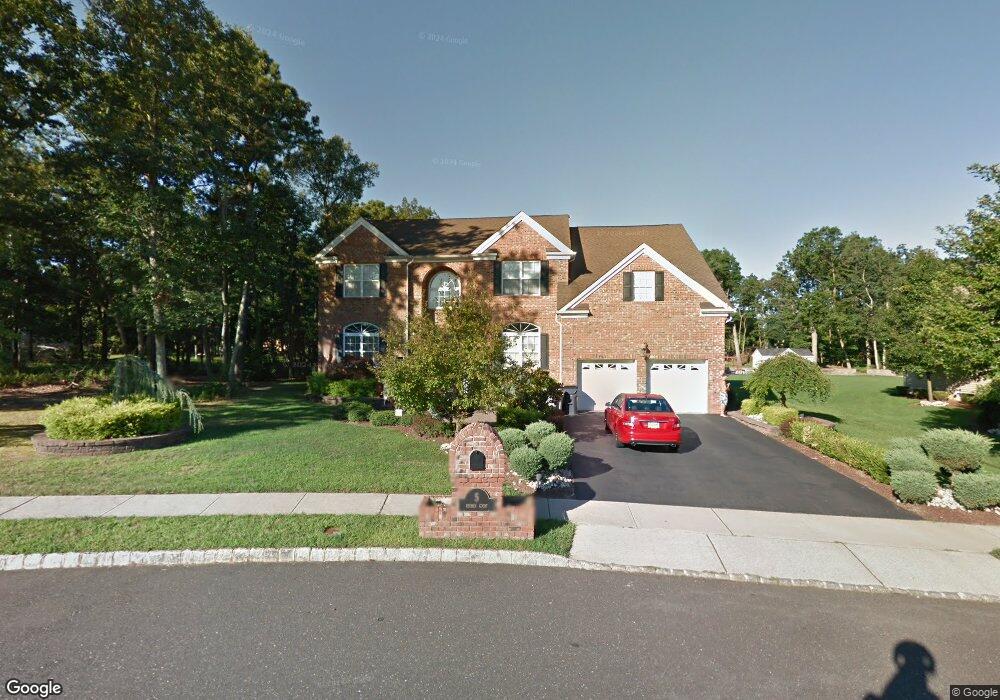
5 Reuben Ct Howell, NJ 07731
Land of Pines NeighborhoodEstimated Value: $1,009,000 - $1,116,000
4
Beds
3
Baths
3,750
Sq Ft
$278/Sq Ft
Est. Value
About This Home
This home is located at 5 Reuben Ct, Howell, NJ 07731 and is currently estimated at $1,042,855, approximately $278 per square foot. 5 Reuben Ct is a home located in Monmouth County with nearby schools including Land O' Pines School, Newbury School, and Howell Middle School North.
Ownership History
Date
Name
Owned For
Owner Type
Purchase Details
Closed on
Mar 16, 2006
Sold by
Countryside Developers Inc
Bought by
Avallone Robert and Avallone Roxanne
Current Estimated Value
Home Financials for this Owner
Home Financials are based on the most recent Mortgage that was taken out on this home.
Original Mortgage
$485,000
Outstanding Balance
$273,292
Interest Rate
6.12%
Mortgage Type
Adjustable Rate Mortgage/ARM
Estimated Equity
$769,563
Create a Home Valuation Report for This Property
The Home Valuation Report is an in-depth analysis detailing your home's value as well as a comparison with similar homes in the area
Home Values in the Area
Average Home Value in this Area
Purchase History
| Date | Buyer | Sale Price | Title Company |
|---|---|---|---|
| Avallone Robert | $606,250 | -- |
Source: Public Records
Mortgage History
| Date | Status | Borrower | Loan Amount |
|---|---|---|---|
| Open | Avallone Robert | $485,000 |
Source: Public Records
Tax History Compared to Growth
Tax History
| Year | Tax Paid | Tax Assessment Tax Assessment Total Assessment is a certain percentage of the fair market value that is determined by local assessors to be the total taxable value of land and additions on the property. | Land | Improvement |
|---|---|---|---|---|
| 2025 | $14,299 | $834,800 | $212,700 | $622,100 |
| 2024 | $13,879 | $805,600 | $187,700 | $617,900 |
| 2023 | $13,879 | $745,400 | $127,700 | $617,700 |
| 2022 | $14,469 | $699,300 | $97,700 | $601,600 |
| 2021 | $14,469 | $604,900 | $97,700 | $507,200 |
| 2020 | $14,001 | $602,200 | $97,700 | $504,500 |
| 2019 | $14,196 | $599,000 | $97,700 | $501,300 |
| 2018 | $13,834 | $581,000 | $97,700 | $483,300 |
| 2017 | $14,738 | $611,800 | $97,700 | $514,100 |
| 2016 | $14,619 | $598,900 | $97,700 | $501,200 |
| 2015 | $14,383 | $583,500 | $95,200 | $488,300 |
| 2014 | $13,641 | $513,400 | $125,400 | $388,000 |
Source: Public Records
Map
Nearby Homes