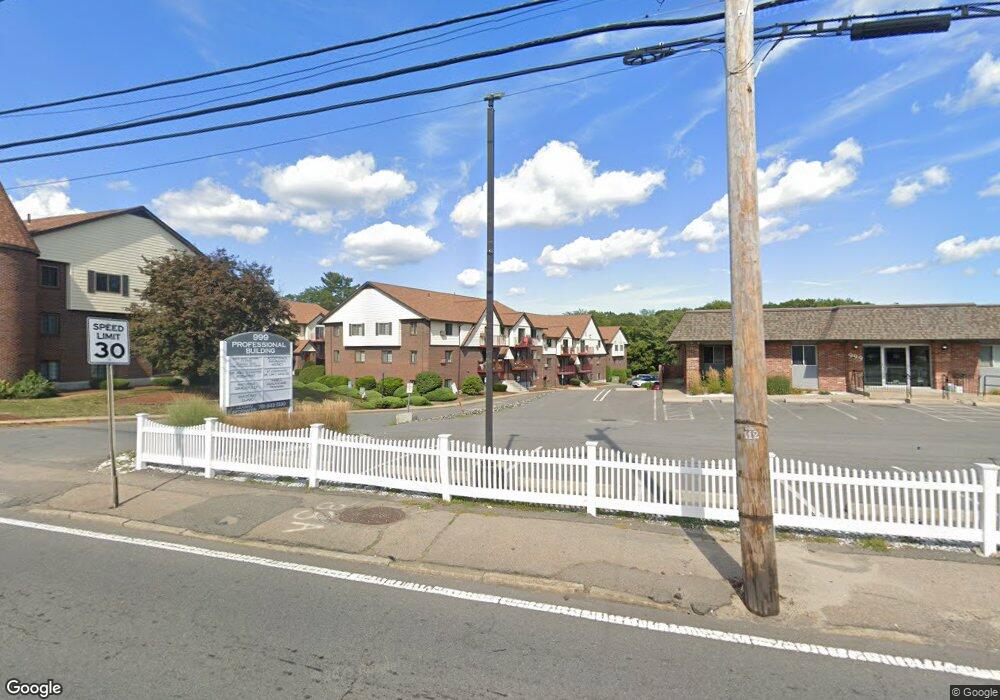
5 Royal Crest Dr Randolph, MA 02368
North Randolph NeighborhoodEstimated Value: $334,000 - $357,000
2
Beds
1
Bath
1,032
Sq Ft
$331/Sq Ft
Est. Value
About This Home
This home is located at 5 Royal Crest Dr, Randolph, MA 02368 and is currently estimated at $341,594, approximately $331 per square foot. 5 Royal Crest Dr is a home located in Norfolk County with nearby schools including Randolph High School and Lighthouse Baptist Christian Academy.
Ownership History
Date
Name
Owned For
Owner Type
Purchase Details
Closed on
May 31, 2013
Sold by
Ocean Real Estate Inv
Bought by
Leka Ramazan and Leka Hazbije
Current Estimated Value
Purchase Details
Closed on
Oct 29, 2004
Sold by
Edouard Marie J
Bought by
Vo My L and Tran Tony
Home Financials for this Owner
Home Financials are based on the most recent Mortgage that was taken out on this home.
Original Mortgage
$164,000
Interest Rate
5.74%
Mortgage Type
Purchase Money Mortgage
Purchase Details
Closed on
May 28, 2004
Sold by
Fielding David M
Bought by
Grant Mark
Purchase Details
Closed on
Sep 26, 2002
Sold by
Ngo Tuan
Bought by
Edouard Marie J
Purchase Details
Closed on
May 22, 2002
Sold by
Brathwaite Gertrude L
Bought by
Ngo Tuan and Huynh Kim
Purchase Details
Closed on
Nov 30, 2001
Sold by
Sadler Rt
Bought by
Brathwaite Gertrude L
Purchase Details
Closed on
Nov 3, 1992
Sold by
Lawler James A
Bought by
Bisset Donald
Create a Home Valuation Report for This Property
The Home Valuation Report is an in-depth analysis detailing your home's value as well as a comparison with similar homes in the area
Home Values in the Area
Average Home Value in this Area
Purchase History
| Date | Buyer | Sale Price | Title Company |
|---|---|---|---|
| Leka Ramazan | $30,600 | -- | |
| Vo My L | $205,000 | -- | |
| Vo My L | $205,000 | -- | |
| Grant Mark | $150,000 | -- | |
| Edouard Marie J | $180,000 | -- | |
| Ngo Tuan | $165,000 | -- | |
| Brathwaite Gertrude L | $150,000 | -- | |
| Bisset Donald | $50,000 | -- | |
| Bisset Donald | $50,000 | -- |
Source: Public Records
Mortgage History
| Date | Status | Borrower | Loan Amount |
|---|---|---|---|
| Previous Owner | Vo My L | $164,000 |
Source: Public Records
Tax History
| Year | Tax Paid | Tax Assessment Tax Assessment Total Assessment is a certain percentage of the fair market value that is determined by local assessors to be the total taxable value of land and additions on the property. | Land | Improvement |
|---|---|---|---|---|
| 2025 | $3,329 | $286,700 | $0 | $286,700 |
| 2024 | $3,097 | $270,500 | $0 | $270,500 |
| 2023 | $2,990 | $247,500 | $0 | $247,500 |
| 2022 | $2,738 | $201,300 | $0 | $201,300 |
| 2021 | $2,378 | $160,900 | $0 | $160,900 |
| 2020 | $2,424 | $162,600 | $0 | $162,600 |
| 2019 | $2,237 | $149,300 | $0 | $149,300 |
| 2018 | $2,277 | $143,400 | $0 | $143,400 |
| 2017 | $2,244 | $138,700 | $0 | $138,700 |
| 2016 | $2,016 | $115,900 | $0 | $115,900 |
| 2015 | $1,864 | $103,000 | $0 | $103,000 |
Source: Public Records
Map
Nearby Homes
- 1 Royal Crest Dr Unit 3
- 9 Royal Crest Dr Unit 12
- 1 Royal Crest Dr Unit 12
- 1004 N Main St
- 23 Old St
- 875 N Main St
- 72 Canton St
- 7 Waldo St
- 26 Eugenia St
- 10 Michael Rd
- 34 Orchard St
- 195 High St
- 20 Simmonds Blvd Unit 20
- 18 Simmonds Blvd Unit 18
- 8 Simmonds Blvd Unit 8
- 22 Simmonds Blvd Unit 22
- 10 Simmonds Blvd Unit 10
- 24 Simmonds Blvd Unit 24
- 12 Howard Ave
- 22 Clark St
- 5 Royal Crest Dr Unit 3
- 5 Royal Crest Dr Unit 9
- 5 Royal Crest Dr Unit 8
- 5 Royal Crest Dr Unit 7
- 5 Royal Crest Dr Unit 6
- 5 Royal Crest Dr Unit 4
- 5 Royal Crest Dr Unit 2
- 5 Royal Crest Dr Unit 1
- 5 Royal Crest Dr Unit 12
- 5 Royal Crest Dr Unit 11
- 5 Royal Crest Dr Unit 10
- 5 Royal Crest Dr Unit 5, 5E
- 5 Royal Crest Dr Unit 8E,5
- 5 Royal Crest Dr Unit 10,5
- 5 Royal Crest Dr Unit 1 5
- 5 Royal Crest Dr Unit 11 5
- 5 Royal Crest Dr Unit 5
- 3 Royal Crest Dr Unit 6D
- 3 Royal Crest Dr Unit 1
- 7 Royal Crest Dr Unit 9
Your Personal Tour Guide
Ask me questions while you tour the home.