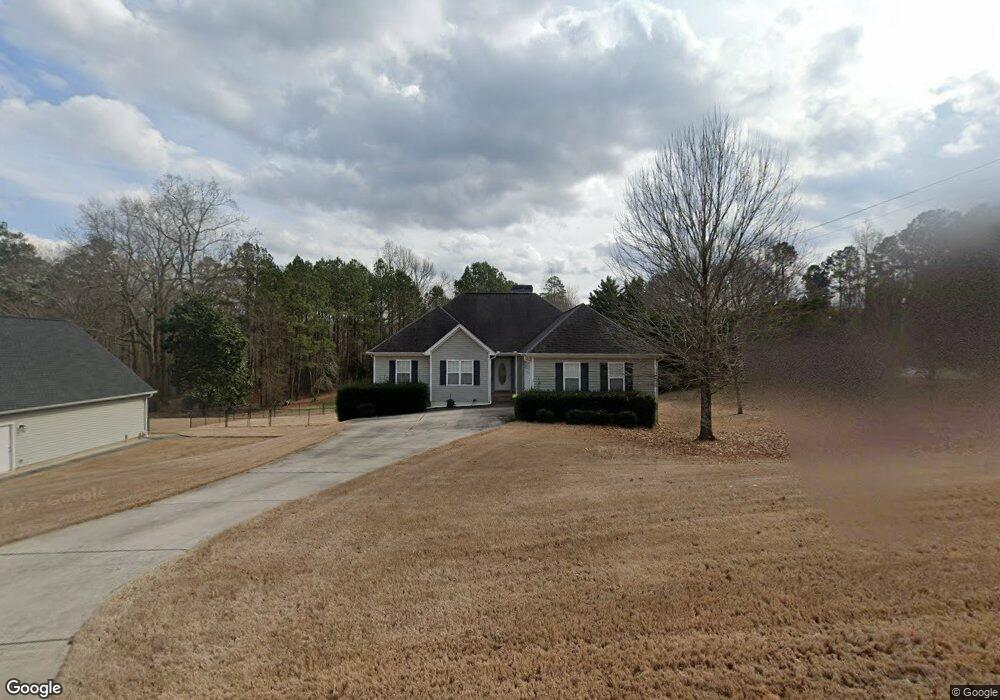
5 Rudders Crossing Newnan, GA 30263
Estimated Value: $410,000 - $515,000
3
Beds
3
Baths
1,714
Sq Ft
$269/Sq Ft
Est. Value
About This Home
This home is located at 5 Rudders Crossing, Newnan, GA 30263 and is currently estimated at $461,268, approximately $269 per square foot. 5 Rudders Crossing is a home located in Coweta County with nearby schools including Arnco-Sargent Elementary School, Madras Middle School, and Newnan High School.
Ownership History
Date
Name
Owned For
Owner Type
Purchase Details
Closed on
Sep 23, 2004
Sold by
Gerald M Rudder Const Inc
Bought by
Ginrich Greg and Ginrich Linda
Current Estimated Value
Home Financials for this Owner
Home Financials are based on the most recent Mortgage that was taken out on this home.
Original Mortgage
$151,920
Outstanding Balance
$74,233
Interest Rate
5.78%
Mortgage Type
New Conventional
Estimated Equity
$387,035
Purchase Details
Closed on
May 5, 2003
Sold by
Rudder/Rudder Inc
Bought by
Gerald M Rudder Const Inc
Home Financials for this Owner
Home Financials are based on the most recent Mortgage that was taken out on this home.
Original Mortgage
$154,000
Interest Rate
5.86%
Purchase Details
Closed on
May 5, 2002
Sold by
Rudder & Rudder Inc
Bought by
Gerald M Rudder Construction Inc
Purchase Details
Closed on
Jun 7, 2000
Sold by
Rudder & Rudder Inc
Bought by
Rudder & Rudder Inc
Create a Home Valuation Report for This Property
The Home Valuation Report is an in-depth analysis detailing your home's value as well as a comparison with similar homes in the area
Home Values in the Area
Average Home Value in this Area
Purchase History
| Date | Buyer | Sale Price | Title Company |
|---|---|---|---|
| Ginrich Greg | $189,900 | -- | |
| Gerald M Rudder Const Inc | $32,500 | -- | |
| Gerald M Rudder Construction Inc | $32,500 | -- | |
| Rudder & Rudder Inc | $422,600 | -- |
Source: Public Records
Mortgage History
| Date | Status | Borrower | Loan Amount |
|---|---|---|---|
| Open | Ginrich Greg | $151,920 | |
| Previous Owner | Gerald M Rudder Const Inc | $154,000 |
Source: Public Records
Tax History Compared to Growth
Tax History
| Year | Tax Paid | Tax Assessment Tax Assessment Total Assessment is a certain percentage of the fair market value that is determined by local assessors to be the total taxable value of land and additions on the property. | Land | Improvement |
|---|---|---|---|---|
| 2025 | $4,168 | $181,254 | $28,000 | $153,254 |
| 2024 | $4,181 | $184,708 | $28,000 | $156,708 |
| 2023 | $4,181 | $167,074 | $22,000 | $145,074 |
| 2022 | $3,488 | $146,277 | $22,000 | $124,277 |
| 2021 | $3,211 | $126,646 | $18,000 | $108,646 |
| 2020 | $3,231 | $126,646 | $18,000 | $108,646 |
| 2019 | $2,995 | $107,119 | $12,000 | $95,119 |
| 2018 | $3,001 | $107,119 | $12,000 | $95,119 |
| 2017 | $2,816 | $100,839 | $12,000 | $88,839 |
| 2016 | $2,003 | $73,869 | $8,000 | $65,869 |
| 2015 | $1,822 | $68,626 | $8,000 | $60,626 |
| 2014 | $1,810 | $68,626 | $8,000 | $60,626 |
Source: Public Records
Map
Nearby Homes
- 50 O'Tara Woods Dr
- 50 Emerald Hills Ln
- 5 Gibson Rd
- 0 J Smith Rd Unit 10192890
- 249 Gibson Rd
- 62 Dawn St
- 168 Piney Wood Dr Unit 8
- 1206 + 0 Macedonia Rd
- 1206 Macedonia Rd
- 11 Hubbard Rd
- 124 Wilmington Ct
- 279 Doc Perry Rd
- 44 Fendley Trace
- 0 & 1206 Macedonia Rd
- 237 Kory Dr
- 48 Garden View Terrace
- 82 Bantry Park Dr
- 264 Kendall St
- 1242 Witcher Rd
- 90 Westwind Dr
- 15 Rudders Crossing
- 0 Emerald Hills Dawn St Unit 30 & 31 8368044
- 10 Rudders Crossing
- 10 Rudders Crossing Unit A-1
- 25 Rudders Crossing
- 2289 Roscoe Rd
- 2310 Roscoe Rd
- 0 Emerald Hills Ln Unit 9 7547145
- 0 Emerald Hills Ln Unit 15 7557004
- 0 Emerald Hills Ln Unit 16 7557001
- 0 Emerald Hills Ln Unit LOT 33 10233285
- 35 Rudders Crossing
- 30 Rudders Crossing
- 5 Emerald Hills Ln
- 35 O Tara Woods Dr
- 15 O Tara Woods Dr
- 15 O Tara Woods Dr Unit 165
- 15 O'Tara Woods Dr Unit 165
- 20 Emerald Hills Ln Unit 1
- 25 O Tara Woods Dr