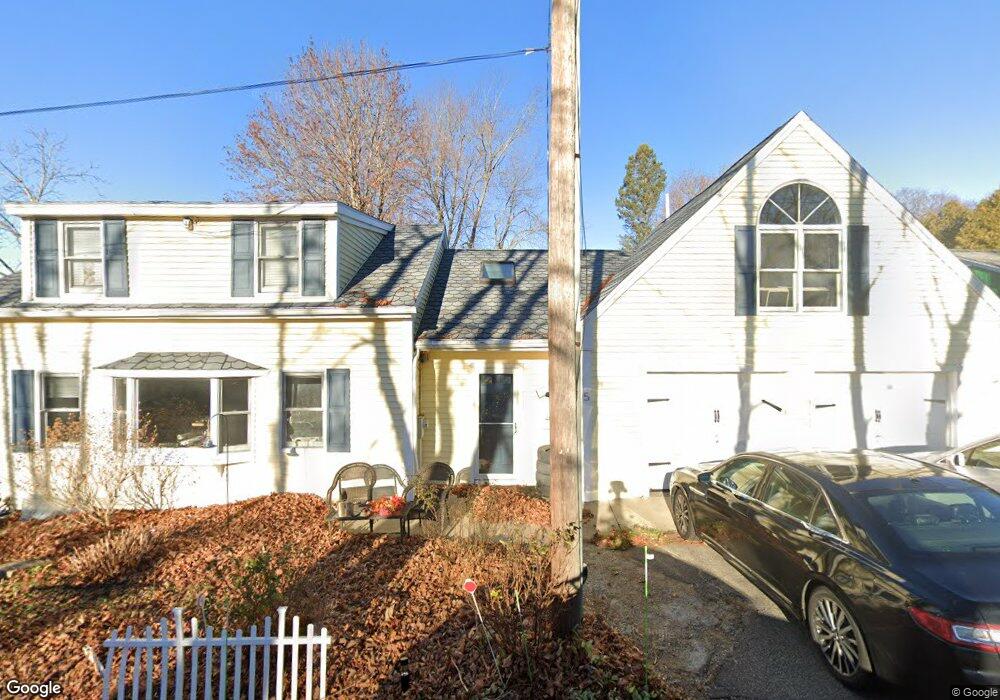
5 Rugby St Biddeford, ME 04005
Estimated Value: $428,000 - $552,000
3
Beds
2
Baths
2,028
Sq Ft
$241/Sq Ft
Est. Value
About This Home
This home is located at 5 Rugby St, Biddeford, ME 04005 and is currently estimated at $488,249, approximately $240 per square foot. 5 Rugby St is a home located in York County with nearby schools including John F Kennedy Memorial School, Biddeford Primary School, and Biddeford Intermediate School.
Ownership History
Date
Name
Owned For
Owner Type
Purchase Details
Closed on
Oct 18, 2019
Sold by
Kenneally Lynn M
Bought by
Conner Paul F
Current Estimated Value
Home Financials for this Owner
Home Financials are based on the most recent Mortgage that was taken out on this home.
Original Mortgage
$246,887
Outstanding Balance
$215,840
Interest Rate
3.4%
Mortgage Type
VA
Estimated Equity
$272,409
Create a Home Valuation Report for This Property
The Home Valuation Report is an in-depth analysis detailing your home's value as well as a comparison with similar homes in the area
Home Values in the Area
Average Home Value in this Area
Purchase History
| Date | Buyer | Sale Price | Title Company |
|---|---|---|---|
| Conner Paul F | -- | -- |
Source: Public Records
Mortgage History
| Date | Status | Borrower | Loan Amount |
|---|---|---|---|
| Open | Conner Paul F | $246,887 |
Source: Public Records
Tax History Compared to Growth
Tax History
| Year | Tax Paid | Tax Assessment Tax Assessment Total Assessment is a certain percentage of the fair market value that is determined by local assessors to be the total taxable value of land and additions on the property. | Land | Improvement |
|---|---|---|---|---|
| 2024 | $4,661 | $327,800 | $108,500 | $219,300 |
| 2023 | $4,276 | $325,900 | $106,600 | $219,300 |
| 2022 | $4,531 | $276,100 | $73,900 | $202,200 |
| 2021 | $4,218 | $231,400 | $62,500 | $168,900 |
| 2020 | $4,229 | $210,900 | $56,800 | $154,100 |
| 2019 | $4,214 | $210,900 | $56,800 | $154,100 |
| 2018 | $4,155 | $210,900 | $56,800 | $154,100 |
| 2017 | $4,122 | $205,400 | $56,800 | $148,600 |
| 2016 | $4,079 | $205,400 | $56,800 | $148,600 |
| 2015 | $3,804 | $205,400 | $56,800 | $148,600 |
| 2014 | $3,711 | $205,400 | $56,800 | $148,600 |
| 2013 | -- | $213,000 | $56,400 | $156,600 |
Source: Public Records
Map
Nearby Homes