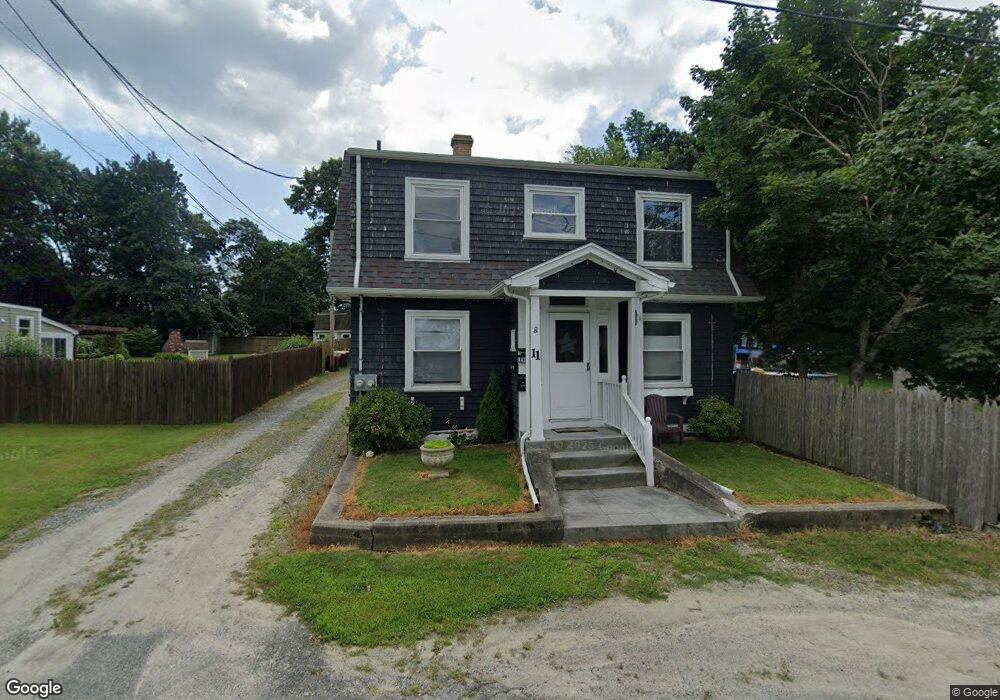
5 Russell St Acushnet, MA 02743
Estimated Value: $409,000 - $461,000
Studio
1
Bath
1,771
Sq Ft
$247/Sq Ft
Est. Value
About This Home
This home is located at 5 Russell St, Acushnet, MA 02743 and is currently estimated at $437,865, approximately $247 per square foot. 5 Russell St is a home located in Bristol County with nearby schools including Acushnet Elementary School, Albert F Ford Middle School, and Alma Del Mar Charter School.
Ownership History
Date
Name
Owned For
Owner Type
Purchase Details
Closed on
Apr 30, 2002
Sold by
Chmielewski Pauline M and Tisdelle Robert J
Bought by
Fortin Albert A and Fortin Tracy L
Current Estimated Value
Home Financials for this Owner
Home Financials are based on the most recent Mortgage that was taken out on this home.
Original Mortgage
$106,950
Interest Rate
7.05%
Mortgage Type
Purchase Money Mortgage
Create a Home Valuation Report for This Property
The Home Valuation Report is an in-depth analysis detailing your home's value as well as a comparison with similar homes in the area
Home Values in the Area
Average Home Value in this Area
Purchase History
| Date | Buyer | Sale Price | Title Company |
|---|---|---|---|
| Fortin Albert A | $112,500 | -- |
Source: Public Records
Mortgage History
| Date | Status | Borrower | Loan Amount |
|---|---|---|---|
| Open | Fortin Albert A | $108,000 | |
| Closed | Fortin Albert A | $106,950 | |
| Previous Owner | Fortin Albert A | $112,000 |
Source: Public Records
Tax History
| Year | Tax Paid | Tax Assessment Tax Assessment Total Assessment is a certain percentage of the fair market value that is determined by local assessors to be the total taxable value of land and additions on the property. | Land | Improvement |
|---|---|---|---|---|
| 2025 | $35 | $328,100 | $105,200 | $222,900 |
| 2024 | $3,618 | $317,100 | $100,700 | $216,400 |
| 2023 | $3,421 | $285,100 | $91,500 | $193,600 |
| 2022 | $3,514 | $264,800 | $86,900 | $177,900 |
| 2021 | $2,946 | $213,000 | $86,900 | $126,100 |
| 2020 | $2,969 | $213,000 | $86,900 | $126,100 |
| 2019 | $2,869 | $202,300 | $86,900 | $115,400 |
| 2018 | $2,797 | $194,000 | $86,900 | $107,100 |
| 2017 | $2,705 | $187,300 | $86,900 | $100,400 |
| 2016 | $2,583 | $177,800 | $86,900 | $90,900 |
| 2015 | $2,539 | $177,800 | $86,900 | $90,900 |
Source: Public Records
Map
Nearby Homes
- 14 Hayes St Unit 1
- 12 Hayes St Unit 1
- 11 Boylston St
- 12 White St
- 0 Hathaway Rd Unit 73469544
- 23 Oliveira Ave
- 91 S Main St
- 122 Truro St
- 25 Pershing Ave
- 81 Sylvia St
- 112 Lawson Ave
- 34 Chicopee St
- 14 Caswell St
- 20 Jake Ln
- 27 Meadow Ln
- 4 Sam St
- 15 Ball St
- 65 Armsby St
- 5 William St
- 1940-1942 Acushnet Ave
Your Personal Tour Guide
Ask me questions while you tour the home.